Do you want to create GOOGLE SHEET SCREENER which shows those stocks which are BREAKING OUT 20 DAY HIGH and 20 DAY LOW?

The concept propounded by SIR RICHARD DONCHIAN
Let's take a deep dive

If you find this interesting then feel free to TAG😁, LIKE👍 and RT♻
Donchain Channel is a very interesting Trend Following Tool which looks as shown below. The UPPER LINE is called UPPER BOUNDARY and the LOWER LINE is called LOWER BOUNDARY. Trades can be set up in two manners
1. Trend Continuation
2. Trend Fading(Turtle Soup - Ref. Street Smart)
The problem over is not the trading part the main problem is to screen out those stock during the market hour or EOD basis for figuring out those stocks which are breaking out of UB or LB. Google Sheets can do a fair amount of job in screening out those stocks
=MAX(INDEX(GoogleFinance("NSE:"&C2,"HIGH",WORKDAY(TODAY(),-20),TODAY()),0,2))

This is the formula which you can put for setting up 20DAY HIGH

Here C2 refers to the cell which contains 'STOCK SYMBOL'
=MIN(INDEX(GoogleFinance("NSE:"&C2,"LOW",WORKDAY(TODAY(),-20),TODAY()),0,2))

This is the formula which you can put for setting up 20DAY LOW

As mentioned above C2 refers to the cell which contains 'STOCK SYMBOL'
The layout that I have set up for my screener is shown below for which I have selected the universe of NIFTY 500 stocks and to filter out the same I have used 'IF' function based on CLOSE & 20DHIGH / 20DLOW
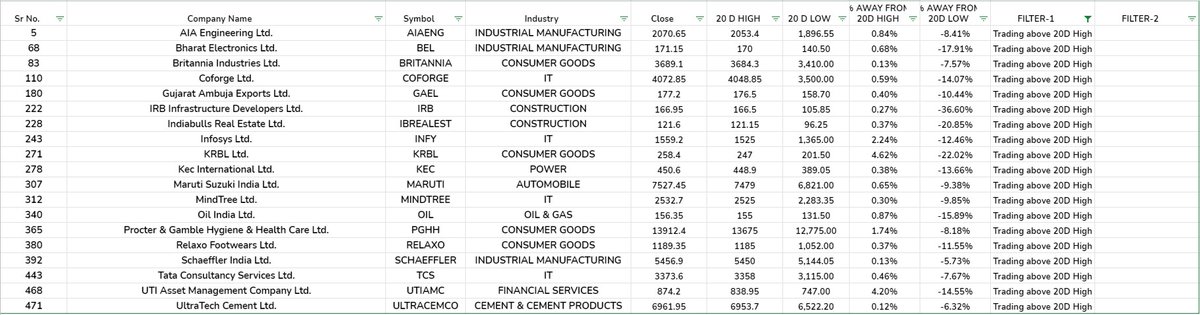
This is not the only way to do the same I found this useful so thought of sharing. There are many other screeners which do the same

@Trendmyfriends is one of the handles which I came across recently and I have found that he is a PRO in this type of TREND FOLLOWING SYSTEM
Basic Functions - GOOGLE FINANCE
support.google.com/docs/answer/30…
docs.google.com/spreadsheets/d…

Those who are looking for the GOOGLE SHEET
Here👆it is

• • •

Missing some Tweet in this thread? You can try to force a refresh
 

Keep Current with 𝗦𝗶𝗱𝗱𝗵𝗮𝗿𝘁𝗵

𝗦𝗶𝗱𝗱𝗵𝗮𝗿𝘁𝗵 Profile picture

Stay in touch and get notified when new unrolls are available from this author!

Read all threads

This Thread may be Removed Anytime!

PDF

Twitter may remove this content at anytime! Save it as PDF for later use!

Try unrolling a thread yourself!

how to unroll video
  1. Follow @ThreadReaderApp to mention us!

  2. From a Twitter thread mention us with a keyword "unroll"
@threadreaderapp unroll

Practice here first or read more on our help page!

More from @siddharth_2410

25 Jun
In this market environment, I think we all are encountering one simple problem. Breakouts are fizzling out so don't you think that we should have at least one method by which we can handle such fizzled breakouts and trade in the opposite direction

So let's take a deep dive
We all know that from failed moves come faster moves but the problem here is we just see the same happening on screen and are not able to capitalize on the same. See the below-attached image for few seconds I think you will get the tone of further discussion Image
If you have observed carefully you must have understood that these encircled regions are the 'FAILED BREAKOUTS'. Now you can take out your charts and find out such failed breakouts you will observe that when the price moves out of range

Cont..
Read 12 tweets
24 May 20
LEARNING POST
[Refining your ENTRIES based on MARKET STRUCTURE]

In this post I will make an attempt to share a simple but effective way of getting into TRADE with LOW RISK

If you find it interesting feel free to "RT"

So let's get started
Most of the time when we want to trade LONG we generally look for a classical pattern of UPTREND i.e. HIGHER HIGH - HIGHER LOW which is the first confirmation to trade LONGS

(See the image for better understanding) Image
Secondly what we look for is we wait for the price to retrace to the zone where it prior faced RESISTANCE and now it will be acting as SUPPORT and from thereon we will initiate LONG based on the concept of ROLE REVERSAL / CHANGE OF POLARITY

A perfect sauce for "PULLBACK TRADING"
Read 7 tweets
23 May 20
Let's discuss about PRICE ACTION PATTERN which gets repeated again and again but that FEAR OF MISSING OUT (FOMO) over rides and people do wrong trade

In this post I will try to explain about human mindset when PRICE starts moving higher/lower
If you find this interesting
"RT"
See in this image you are able to see that price is moving higher from a zone which is marked with horizontal boundaries and from there price moves up without looking back
Let say in this manner that if this much PRICE ACTION is present in front of you where you will take a trade Image
Accordingly there will be two categories of traders
1. Those who will try to take trade at CMP
2. Those who are waiting for PRICE to retrace back to POINT-A and then take a trade

You know why people will be ready to take trade at CMP because of one simple reason "CONFIDENCE"
Read 14 tweets
10 Apr 20
LEARNING POST:
DEMAND-SUPPLY ZONE

In this is post I will make an attempt to explain DEMAND - SUPPLY ZONE. Before we proceed some basic idea about DEMAND-SUPPLY.

1. DEMAND > SUPPLY: Price will RISE
2. SUPPLY > DEMAND: Price will FALL
3. SUPPLY = DEMAND: Price will CONSOLIDATE
When the price RISES/FALLS there is an IMBALANCE which is created and if in this IMBALANCE DEMAND > SUPPLY then you will see PRICE WILL RISE. On the contrary if in this IMBALANCE SUPPLY > DEMAND then you will see PRICE WILL FALL.
There will a point of time when the MARKET WILL REACH AN EQUILIBRIUM POINT that is the point where DEMAND = SUPPLY and the PRICE starts CONSOLIDATING or the PRICE will start moving in a RANGE

Cont..
Read 20 tweets
1 Apr 20
LEARNING POST! (Refer the image)

Whenever I come across charts I find many traders doing this mistake.
The mistake the do is when the stock starts coming down they start buying when the price comes in ZONE-1 by putting a SL around the region marked with black dotted line .. Image
The price initially bounces but soon it traps and falls below the zone takes of the SL and then the trader puts a question mark on his capabilities to trade. See firstly there is nothing wrong in trading with zones I personally trade with zones but the mistake here is..
If you are seeing ZONE-1 you must have noticed that below it there is presence of liquids/fluids which means these are consecutive green candles and these are like PATH OF LEAST OBSTACLES. So when you are buying at ZONE-1 you are having a very big risk that the price can easily .
Read 6 tweets
16 Sep 19
SOME KEY POINTERS ON OPTION CHAIN:
1. The first and foremost rule is we need to check OPTION CHAIN on DAILY basis. The prime problem with most of us is we wake up one fine morning and start analyzing by using the "STANDARD RULE" and apply the following logic
PRICE ↓ OI ↓ - Long Liquidation
Price ↑ OI ↑ - Long Buildup
Price ↑ OI ↓ - Short Covering
Price ↓ OI ↑ - Short Buildup
In short most of us consider these logic as "RULE OF THUMB" but actually they are not because these STANDARD RULES work when NEW POSITIONS ARE DEVELOPED
So the bottom line of POINT-1
- Make an habit of daily tracking OPTION CHAIN
-Apply STANDARD RULES when NEW POSITIONS ARE DEVELOPED and NOT when OLD/PRIOR POSITIONS are changed or played with
Read 7 tweets

Did Thread Reader help you today?

Support us! We are indie developers!


This site is made by just two indie developers on a laptop doing marketing, support and development! Read more about the story.

Become a Premium Member ($3/month or $30/year) and get exclusive features!

Become Premium

Too expensive? Make a small donation by buying us coffee ($5) or help with server cost ($10)

Donate via Paypal Become our Patreon

Thank you for your support!

Follow Us on Twitter!

:(