The housing market in a nutshell over the last fifty years? House prices up; interest rates down (although mortgage terms and loan-to-value ratios have changed a bit too).
In new research published today, and funded by @NuffieldFound , we ask which generation has had the better deal when it comes to buying a first home: resolutionfoundation.org/publications/s…
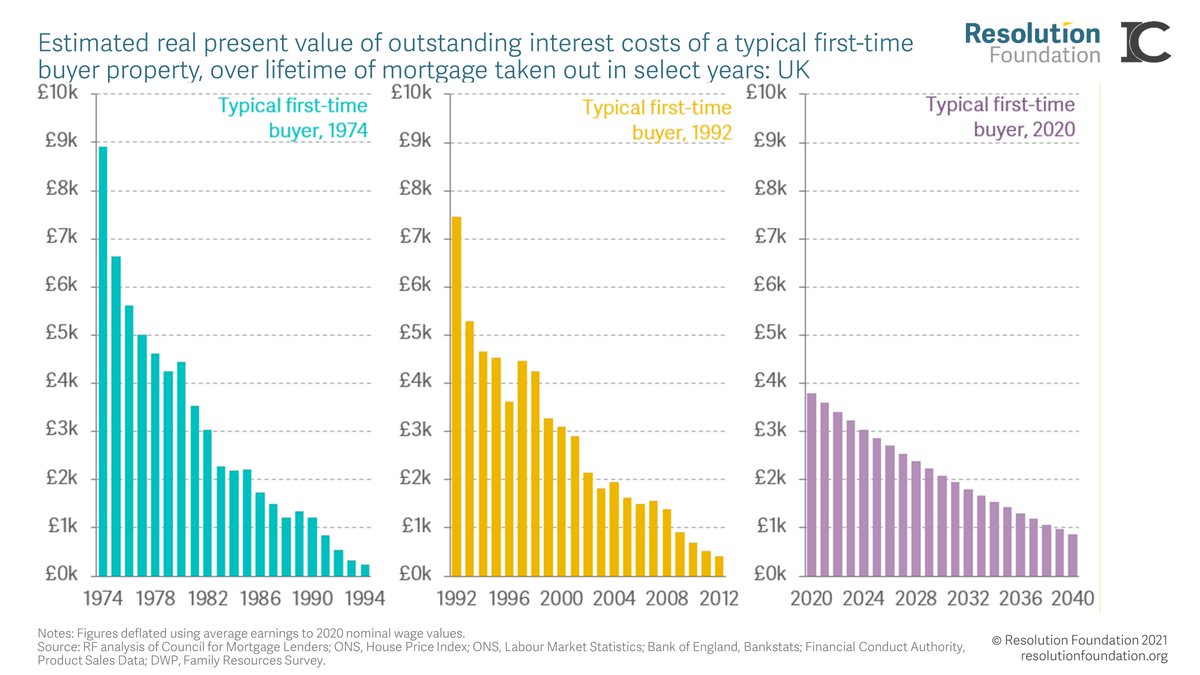
Sky-high interest rates in the 1970s, 1980s and early 1990s meant that older generations had a stressful time, especially in the early years of a mortgage...
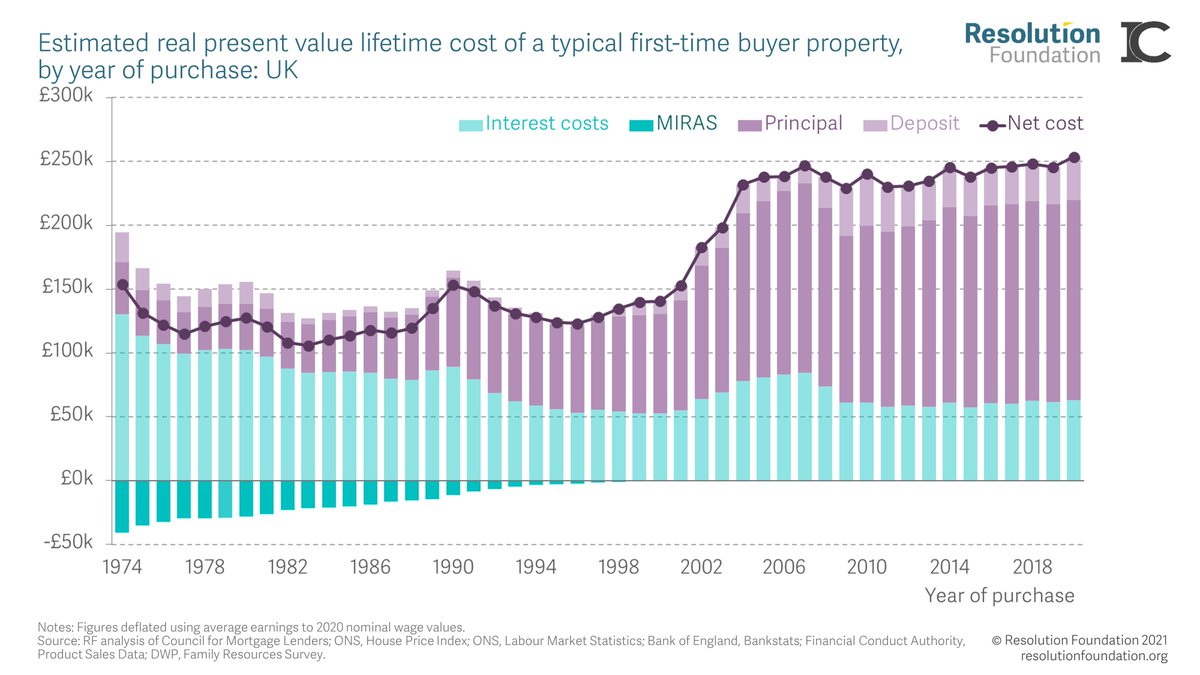
Over the course of their first mortgage term, however, they actually paid less interest overall than those buying in the run-up to the GFC, not least because they got generous tax relief via MIRAS.
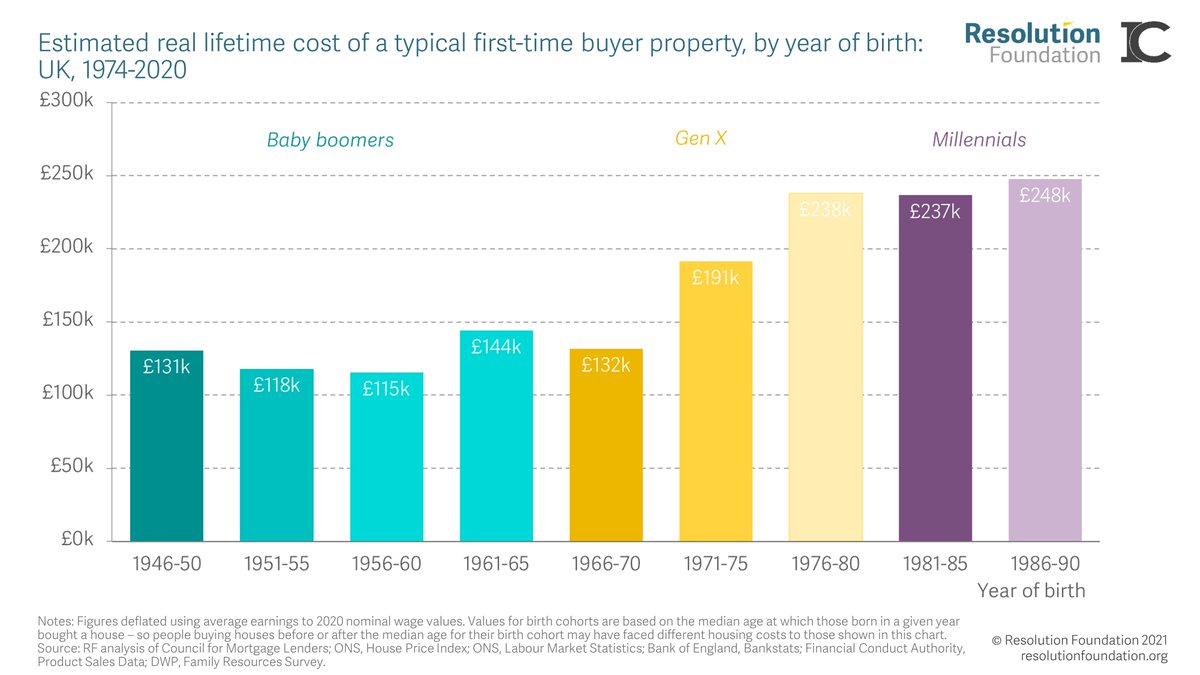
In contrast, today’s wannabe first-time buyers face much higher real house prices, requiring them to find significantly more cash both to get on the ladder in the first place and reach the point when they own their home outright.
But it’s not just millennials who have been hard hit. Total costs of buying one’s first home escalated rapidly for the Gen-Xers too.
These intergenerational differences vary considerably across the country. The typical first time in London in 2020 faced total costs of over £500,000, 2.5 times as much as the typical buyer in the capital in 1974. In the North East, costs changed just 9 per cent over that time.
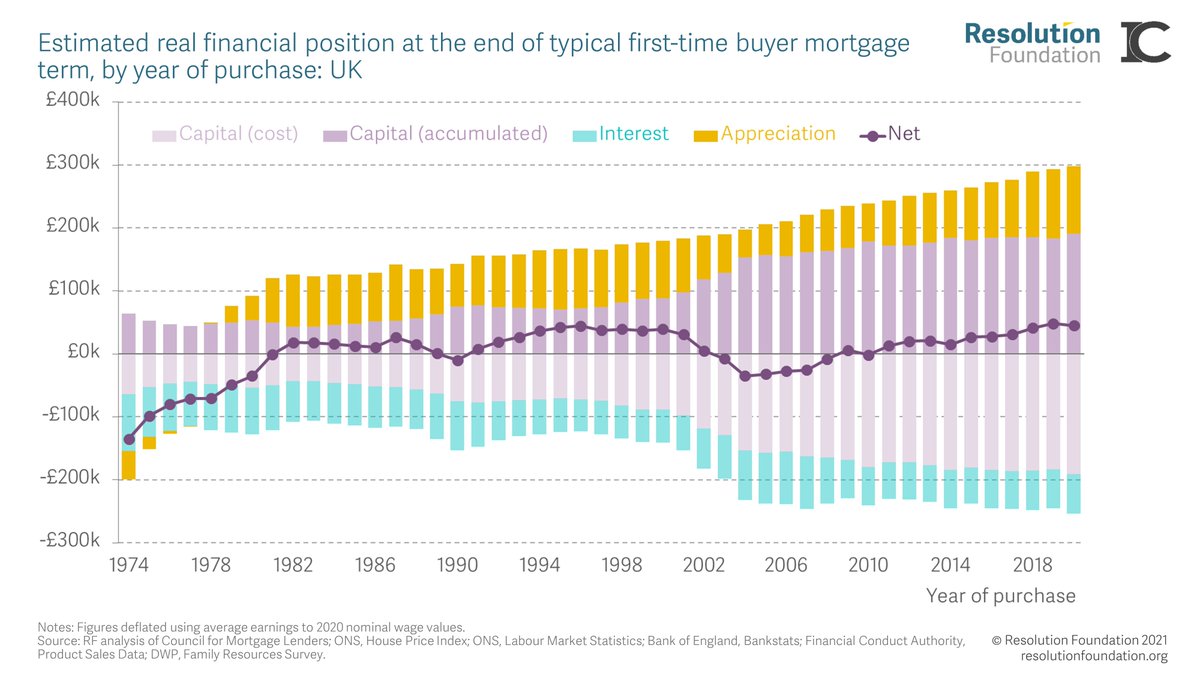
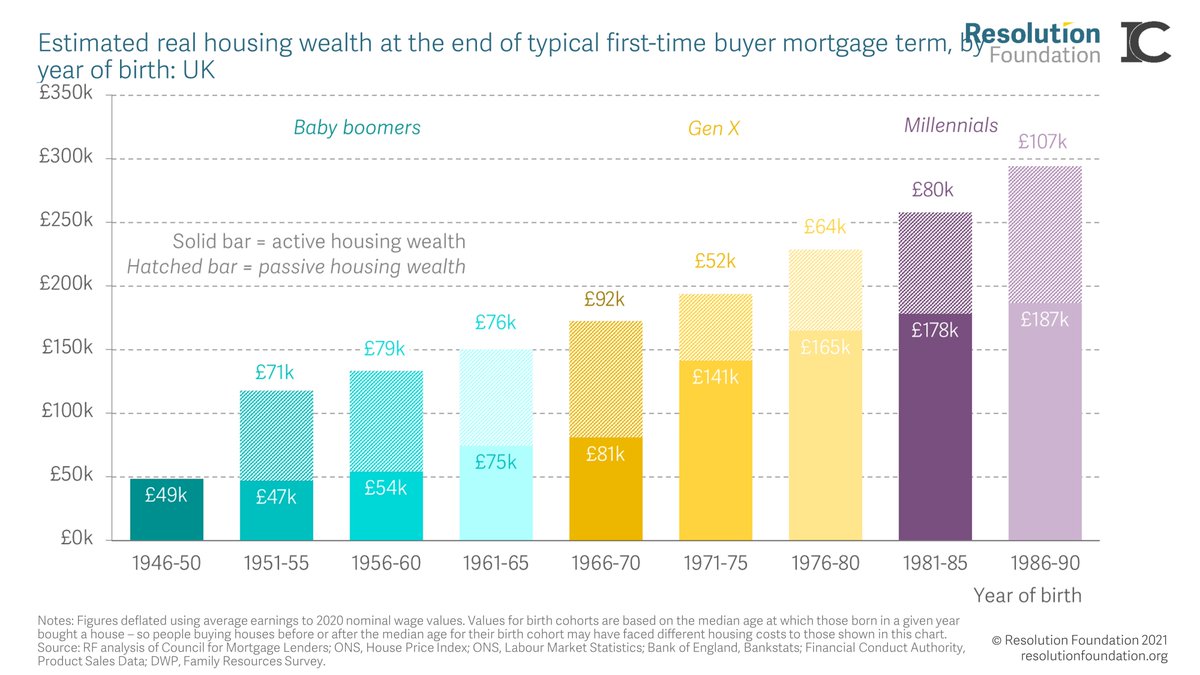
Of course, a paid-off mortgage is also money saved. But today’s first-time buyers do not look set to experience the windfall gains that older generations did when it comes to house price appreciation …
… so although they will end their first mortgage with more property wealth than any previous generation, far more of it will have been ‘active’ (i.e. saved) than ‘passive’ (i.e. the result of rampant house price growth).
Given these eye-watering figures, it’s not surprising young people today find it much harder than their parents’ and grandparents’ generation to get on the housing ladder. 55% of those born 1956-1960 were homeowners by the age of 30, compared to just 27% for those born 1981-1985
Here’s one reason why. A family headed by someone born in the early 1970s, with typical family income levels, would have saved enough for a first-time deposit by the age of 22. It will take a family headed by someone born in 2002 up to their 36th birthday to save for a deposit.
All-in-all, home ownership is increasingly the preserve of the better off. In 1996, the typical first-time buyer family had an income that put them at the 38th percentile of the income distribution of their age group; by 2020 they stand at the 48th percentile.

• • •

Missing some Tweet in this thread? You can try to force a refresh
 

Keep Current with Resolution Foundation

Resolution Foundation Profile picture

Stay in touch and get notified when new unrolls are available from this author!

Read all threads

This Thread may be Removed Anytime!

PDF

Twitter may remove this content at anytime! Save it as PDF for later use!

Try unrolling a thread yourself!

how to unroll video
  1. Follow @ThreadReaderApp to mention us!

  2. From a Twitter thread mention us with a keyword "unroll"
@threadreaderapp unroll

Practice here first or read more on our help page!

More from @resfoundation

27 Jan
Today’s BBC report highlights the big hit to self-employed workers in the Covid-19 crisis. Our research has shown that the self-employed have faced a huge income shock – but support is poorly targeted. A thread…
At the height of last spring’s lockdown, three-in-ten self-employed people were left entirely without work. And even when the economy was opening up in September, more than half still had a lower income than before the crisis, and one-in-six were still without work.
All groups of self-employed workers have been impacted, but the young most of all – in September, a quarter of 18-34-year-olds self-employed workers didn’t have any work.
Read 10 tweets
26 Jan
This morning’s @ONS data shows the labour market continuing to weaken last autumn, with redundancies reaching a record high in the three months to November. But timely data for November and December offers more of a mixed picture. (Full reaction thread)
In headline terms, the main story is one of ongoing weakening towards the end of 2020. The unemployment rate reached 5 per cent in the three months to November (for the first time since 2016).
The Labour Force Survey continues to have some measurement challenges. There is a group who describe themselves as employed but who aren’t working and aren’t being paid. Adding them to the unemployment count takes the rate closer to 6 per cent.
Read 20 tweets
25 Jan
New @ONS data out this morning showed that social care workers had significantly higher death rates from Covid-19 than the general population. This makes it a timely moment to remind ourselves of the pay and conditions facing frontline care staff. A short thread...
Back in April we found that approximately half of frontline care workers are paid less than the real Living Wage, with England the worst offender out of the nations of the UK. In the private sector (where most care workers are employed), this rises to as many as two-in-three. Image
When it comes to employment status and conditions, one-in-ten frontline social care staff are on zero-hour contracts - five times that of the economy as a whole. Given that many care workers have caring responsibilities of their own, this is particularly concerning. Image
Read 4 tweets
25 Jan
Kicking off our #LivingPension webinar, @davidfinchthf notes the very welcome context of a universal flat rate pension, and the successful roll-out of auto-enrolment, which has got millions more workers saving for their retirement. Image
@davidfinchthf And the success of auto-enrolment is badly needed, as people are saving from a very low base of existing pension saving.... Image
@davidfinchthf How much do you need for an adequate income in retirement? It ranges by family type and housing tenure. We take an average to set a Living Pension savings target. Image
Read 4 tweets
28 Oct 20
Our latest report out today examines the impact of the pandemic on the labour market so far. With the furlough scheme ending this week, our analysis reveals the true nature of Britain’s jobs crisis. A short thread… resolutionfoundation.org/publications/j…
Around one-in-five young people, and over one-in-five black, Asian and minority ethnic (BAME) workers, who were furloughed during lockdown have since their lost jobs – and just one-in-three young people who have lost their jobs have been able to find new work.
Since February, the incidence of insecure work declined most among the youngest and the lowest-paid, reflecting the fact that these groups worked on insecure contracts at much higher-than-average rates even before the crisis.
Read 12 tweets
26 Oct 20
Since April, over 400,000 self-employed workers claimed SEISS despite not losing any income during the crisis, while almost 500,000 people still without work have received no support at all. Listen to our key findings from @hcslaughter_
Self-employed workers were hardest hit in April, with 30% completely out of work. While the number out of work has reduced since then, more than half of self-employed workers are still receiving lower pay than before the crisis.
Nearly a quarter of 18-34-year-olds and those educated to A Level or below who were self-employed pre-crisis were still without work in September.
Read 6 tweets

Did Thread Reader help you today?

Support us! We are indie developers!


This site is made by just two indie developers on a laptop doing marketing, support and development! Read more about the story.

Become a Premium Member ($3/month or $30/year) and get exclusive features!

Become Premium

Too expensive? Make a small donation by buying us coffee ($5) or help with server cost ($10)

Donate via Paypal Become our Patreon

Thank you for your support!

Follow Us on Twitter!

:(