
Job growth volatility has increased during the pandemic and reflects both real volatility—economic reverberations of the pandemic shock—as well as heightened measurement error due to the challenge of collecting statistical data amidst a pandemic. 1/
These considerations warn against placing too much weight on any single data point in assessing the current state of the economy, even as the worst of pandemic in the U.S. fades away. 2/
While this blog focuses specifically on the jobs numbers, increased volatility is not specific to the employment report. In general, economic data during the pandemic and the current recovery have been volatile and challenging to forecast. 3/
Even professional economic forecasters have seen marked increases in their typical absolute forecast errors. A careful analysis of today’s economy therefore requires looking for trends that hold over multiple months and across data sources. 4/
A simple starting point for measuring noise is the volatility of job growth—as measured by its standard deviation—over the last three months (where job growth itself is measured as the change in total nonfarm payrolls (NFP). 5/
During the period of job loss in the depths of the Great Recession, the standard deviation of monthly job growth within a rolling three-month window was about 120,000. During the recovery from the Great Recession from 2011 to 2019, this fell to 70,000. 6/ 

In 2020, the average standard deviation was over 3.5 million. From January 2021 onward—when pandemic-related job losses ended—the average has been around 280,000, which is about four times what it was in the Great Recession recovery. 7/
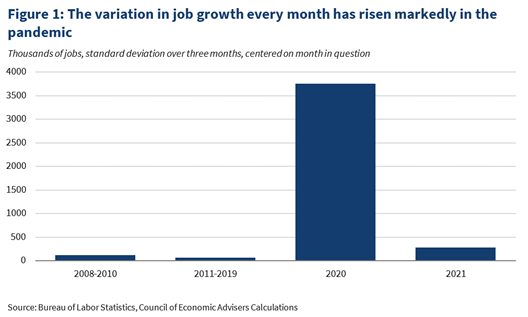
Using the standard deviation over three months as a proxy for a 90 percent confidence interval, there is a wide range of what any particular one month of job growth could be. 8/

(Figure 2 looks at September 2020 onwards due to scale issues with looking earlier in the pandemic) 9/
Another signature of pandemic-related volatility is that job growth over one month has become less predictive of job growth in the next month, meaning there is less persistence and more uncertainty. 10/
One way to measure this is with a series of short-sample (6 months) rolling regressions, which shows the relationship between two consecutive months of jobs growth. 11/
Immediately before the pandemic, one month of job growth data was typically a strong predictor of the next month, with a coefficient estimate that was close to 1 just before the pandemic and was generally statistically–significant. 12/

Since the pandemic began, however, this predictive relationship has weakened. For much of last year, the predictive relationship was essentially zero. 13/

While the previous month’s job growth is now more predictive than it was at the start of the pandemic, it is only about half as predictive as it was just prior to the pandemic, with a coefficient of around 0.5 that is not statistically–significant. 14/
Thus, when monthly job growth has run above or below average, it is more fleeting and less persistent than what we have seen in the past. In other words, one bad or good month provides less information about the future path of job growth than it has in the past. 15/
Employment data by industry show that the economy remains in rapid transition. Two measures of the between-industry dispersion in monthly job growth are still higher in the latest month of economic data (May 2021) than on average over the two years before the pandemic. 16/

The high level of industry employment churn suggests that, as the U.S. economy reopens, swings in total employment may be more likely to reflect the reallocation of workers between industries rather than changes in broad macroeconomic conditions. 17/
It is easier to hit a still target than a moving one. Similarly, statistical agencies make larger revisions to their initial estimates of economic data in tumultuous periods, like a recession, than in calmer times. 18/
Data from 1980 to February 2020 show that Bureau of Labor Statistics (BLS) revisions of monthly job growth are significantly larger in magnitude when BLS initial estimates of job growth have had more volatility over the preceding six months. 19/
The figure below presents the relationship between job-growth volatility and the absolute magnitude of jobs-data revisions. This “binned scatterplot” illustrates the relationship between economic volatility and the size of data revisions. 20/

In normal economic conditions, the U.S. labor market has significant seasonal swings in employment. For example, there is usually a surge of hiring for leisure and hospitality jobs just before the summer, which then produces a wave of layoffs and quits at the summer’s end. 21/
The BLS seasonally–adjusts the data to correct for this sort of characteristic monthly or seasonal behavior. 22/
Amid the pandemic, however, industries may have broken their typical seasonal employment patterns and instead, may have—and continue to let—their employment decisions be guided by other factors, such as local COVID-19 prevalence and risk aversion. 23/
If these extraordinary issues swamp normal seasonal variation, seasonal adjustments may instead temporarily exacerbate volatility. 24/

Even in a steadier economy, macroeconomic forecasting is difficult. To forecast “target” variables such as gross domestic product (GDP) or the unemployment rate, forecasters collect data on other variables that would inform the future value of the target. 25/
In a pandemic, once-stable statistical relationships between macroeconomic variables begin to break down, causing forecast models to make faulty predictions. 26/
During the pandemic, forecast errors for the unemployment rate and employment growth have risen to series highs and have remained—on average—well above pre-pandemic levels. 27/
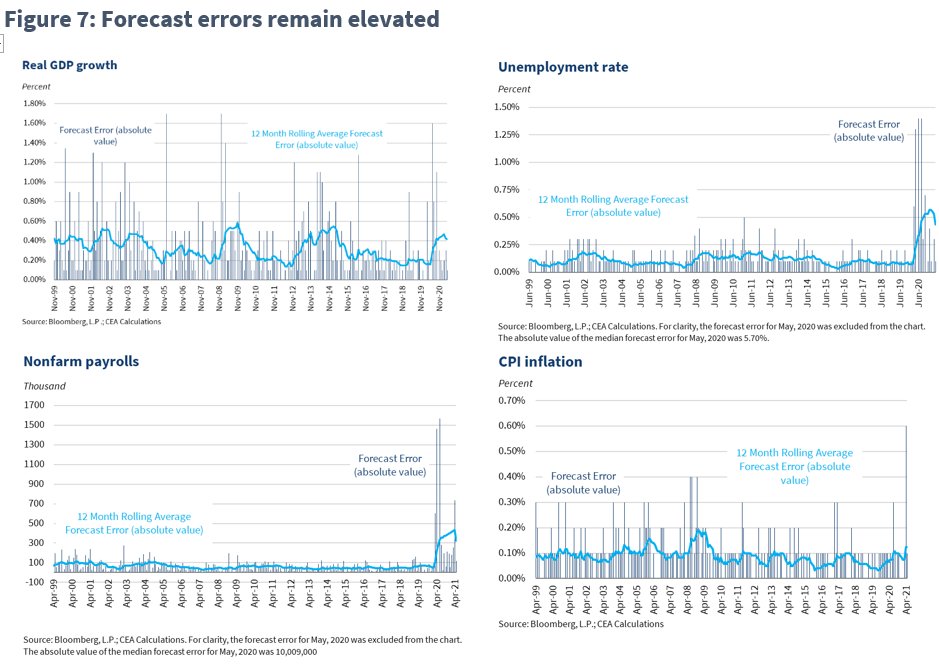
Forecast errors for real GDP rose to the higher end of their historical range, while forecast errors for inflation—as measured by changes in the Consumer Price Index—have only risen modestly, with larger errors in recent months. 28/

Volatility has always been an issue in economic statistics. Veteran users of such data can recall times when data have offered confusing or misleading clues about the economy. 29/
The Council of Economic Advisers takes seriously all incoming data to offer the President its most informed assessment of economic conditions. 30/
The full blog is here: whitehouse.gov/cea/blog/2021/…
• • •
Missing some Tweet in this thread? You can try to
force a refresh


