1/ Here is a more detailed breakdown of the Wyckoff Accumulation Schematic. #BTC has been giving early bullish signals on Supply/Demand, Buying Test Requirements and Effort/Result principles.
@100trillionUSD
@APompliano
Time for a thread
👇👇👇
@100trillionUSD
@APompliano
Time for a thread
👇👇👇
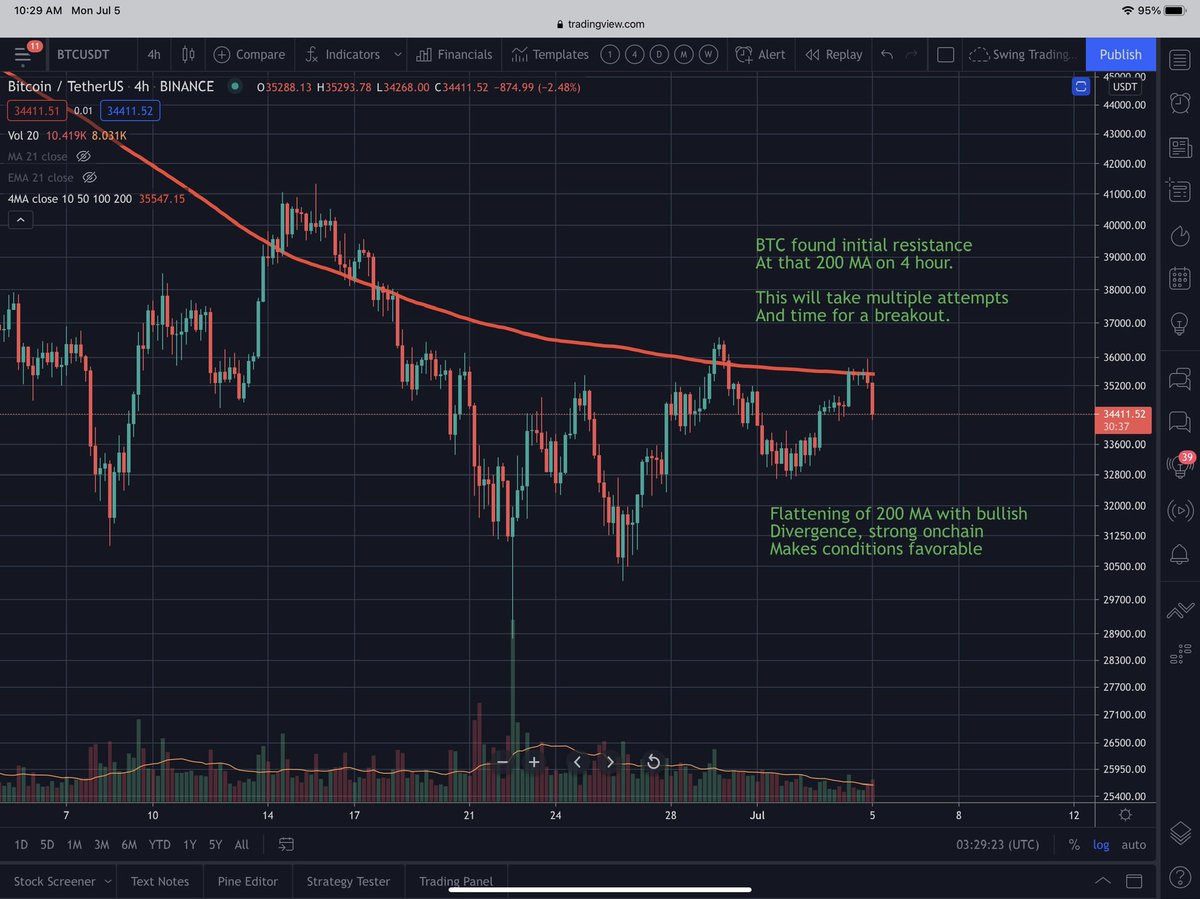
2/ Here is the current chart of #BTC with each Phase marked. Current price action suggests #BTC just formed the Spring and Test in Phase C and is attempting to forming a higher high and higher low for validation. 

3/ Test #2 consists of PS, SC, AR, and ST. Volume is expected to decline throughout the #trading range, a signal of less supply available, thereby weakening selling pressure. Also notice the near term downtrend being broken.

4/ Here is the first major leg down to start Phase A. #BTC price fell significantly with very high volume. This shows harmony between Effort (volume) and Result (price). This indicates supply is greater than demand causing price to fall. We know that the market was highly...

leveraged long, which led to forced liquidations.
5/ Here is the Secondary Test in Phase B. #BTC price fell, but with significantly less volume compared to the SC. In this case, it took less Effort (volume) for a lower Result (price). This indicates there is less supply available. Overall a cautious and positive signal.

6/ This chart shows #BTC falling in the Spring Phase, but not as much as the previous reactions. More importantly, volume is significantly higher, which shows the presence of larger #buyers absorbing supply.

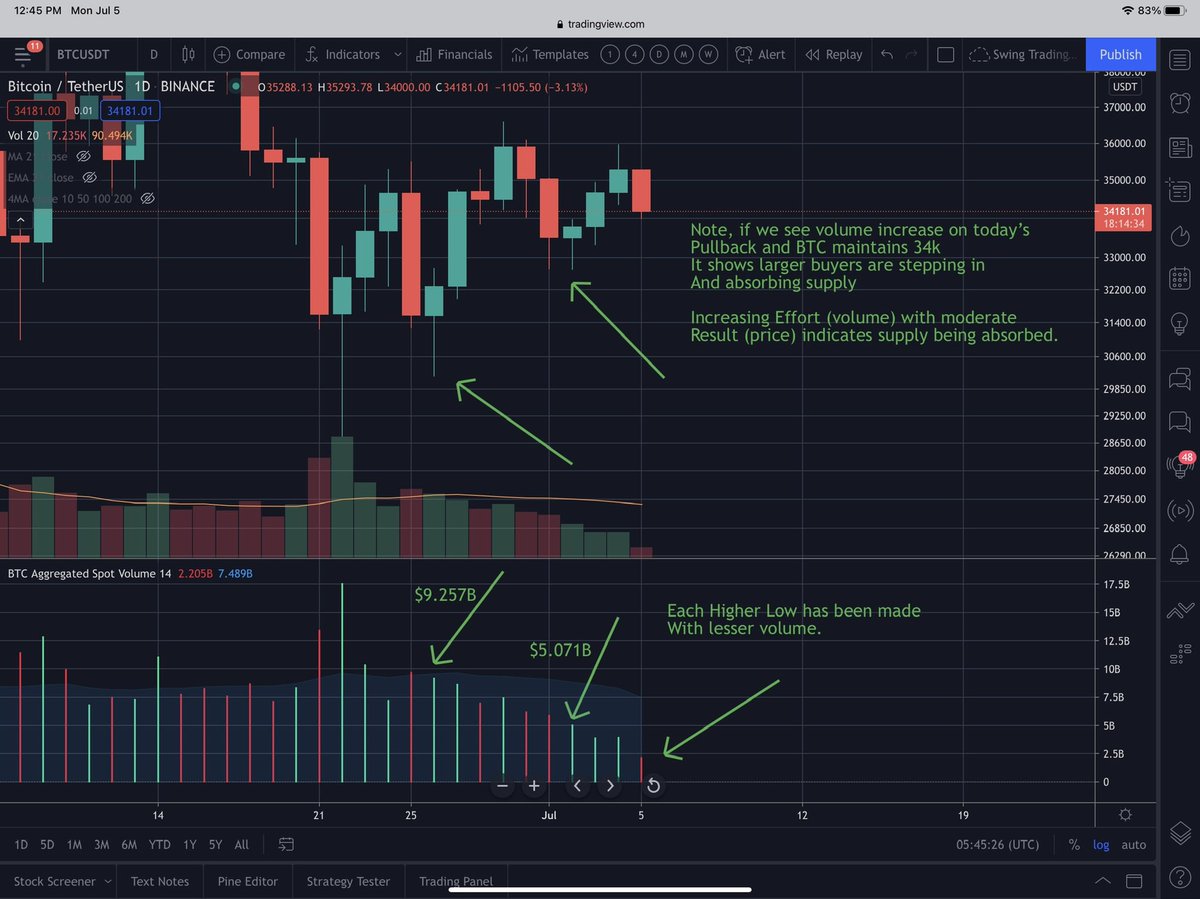
7/ #BTC has consolidated for over a month now with a base of support at 30k, with increasing volume on drawdowns indicating large buyers are absorbing supply. Volume has been trending lower during the consolidation which signals supply is falling and weakening selling

8/ #BTC recently formed the Spring and Test in Phase C, held major support at 30.1k and is now looking to start a move higher. So far we can see a Higher High forming. At the moment, #BTC is attempting to form a Higher Low, which will further validate the Spring and Test, and

suggest the larger operators could be ready to Mark Up. The key will be increasing volume on the next #rally.
9/ The price action suggests BTC is making progress in the Wyckoff Accumulation. If #BTC can make a higher low and hold 30k, this will signal the large operators are getting ready to mark up. Factoring in other technical indicators and #Onchain analysis further supports the
#accumulation we are seeing with LTH and New Users on the network.
10/ If you enjoyed this thread, make sure to follow me for more #updates! Feel free to share my #analysis! 👍👍🚀🚀
@JanWues let me know what you think!
@the_coinmaster let me know your thoughts! As we discussed, we will have to see how it plays out and update as we go.
@venturefounder let me know what you think of my analysis! Btw, just started following you, love your TA and posts on #BTC. Keep it up.
@WClementeIII let me know your thoughts Will! I think the data supports your Onchain analysis, especially in the past month of consolidation between 30k to 40k.
@ByzGeneral would like to know your thoughts on this. Thanks!
@crypto_caesar1 would love to hear your thoughts on my analysis on accumulation!
• • •
Missing some Tweet in this thread? You can try to
force a refresh