
Weekly update #BTC
Long term technicals and Onchain remain bullish. The next 3 to 5 weeks will be critical in determining direction for BTC. It is very important for BTC to close back above the 21 week for bullish continuation and to avoid a bearish crossover on my 21/40 rule👇
Long term technicals and Onchain remain bullish. The next 3 to 5 weeks will be critical in determining direction for BTC. It is very important for BTC to close back above the 21 week for bullish continuation and to avoid a bearish crossover on my 21/40 rule👇
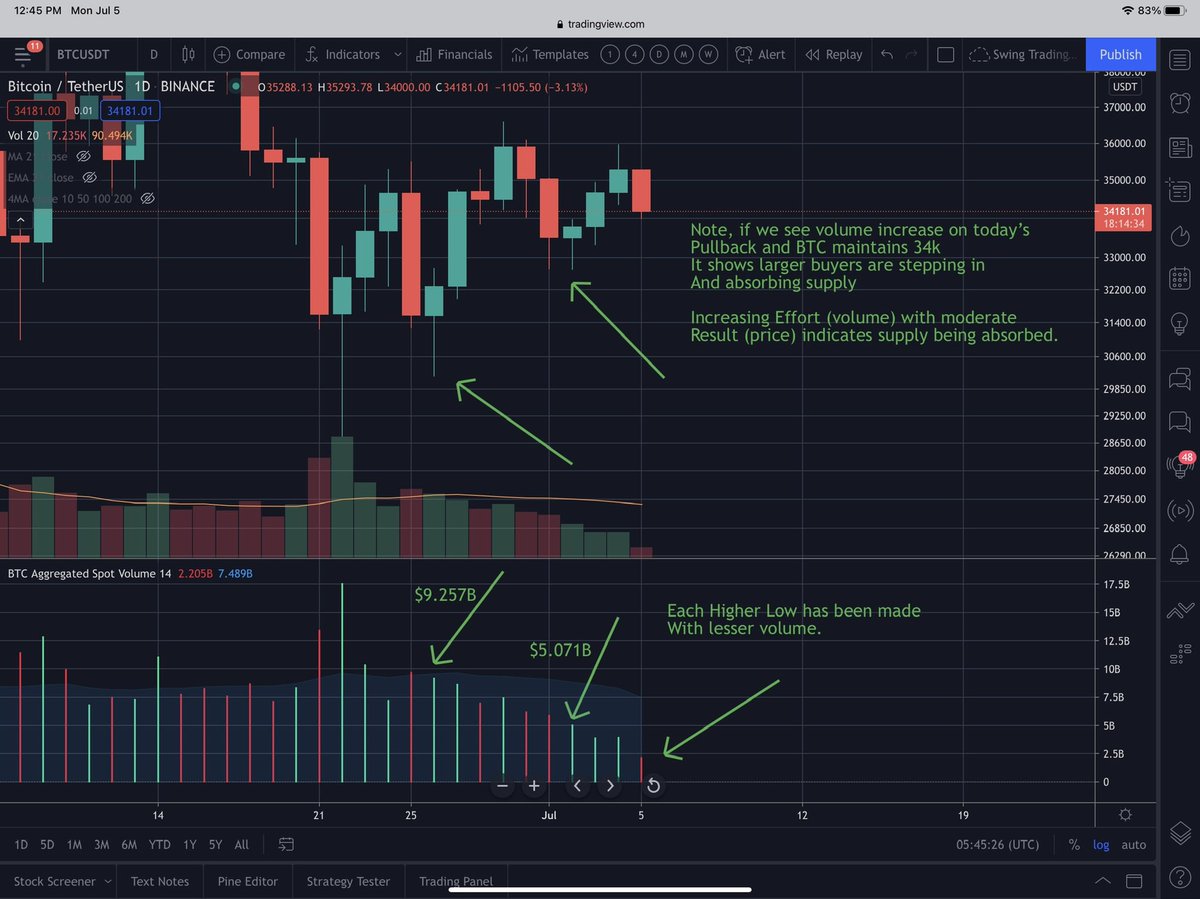
This weeks price action formed the Higher Low at 32.7k, with less volume, a positive signal indicating further supply exhaustion.
Near term we need to see #BTC push above and stay above 35.5k and 36.6k to help form the next higher high.
Near term we need to see #BTC push above and stay above 35.5k and 36.6k to help form the next higher high.
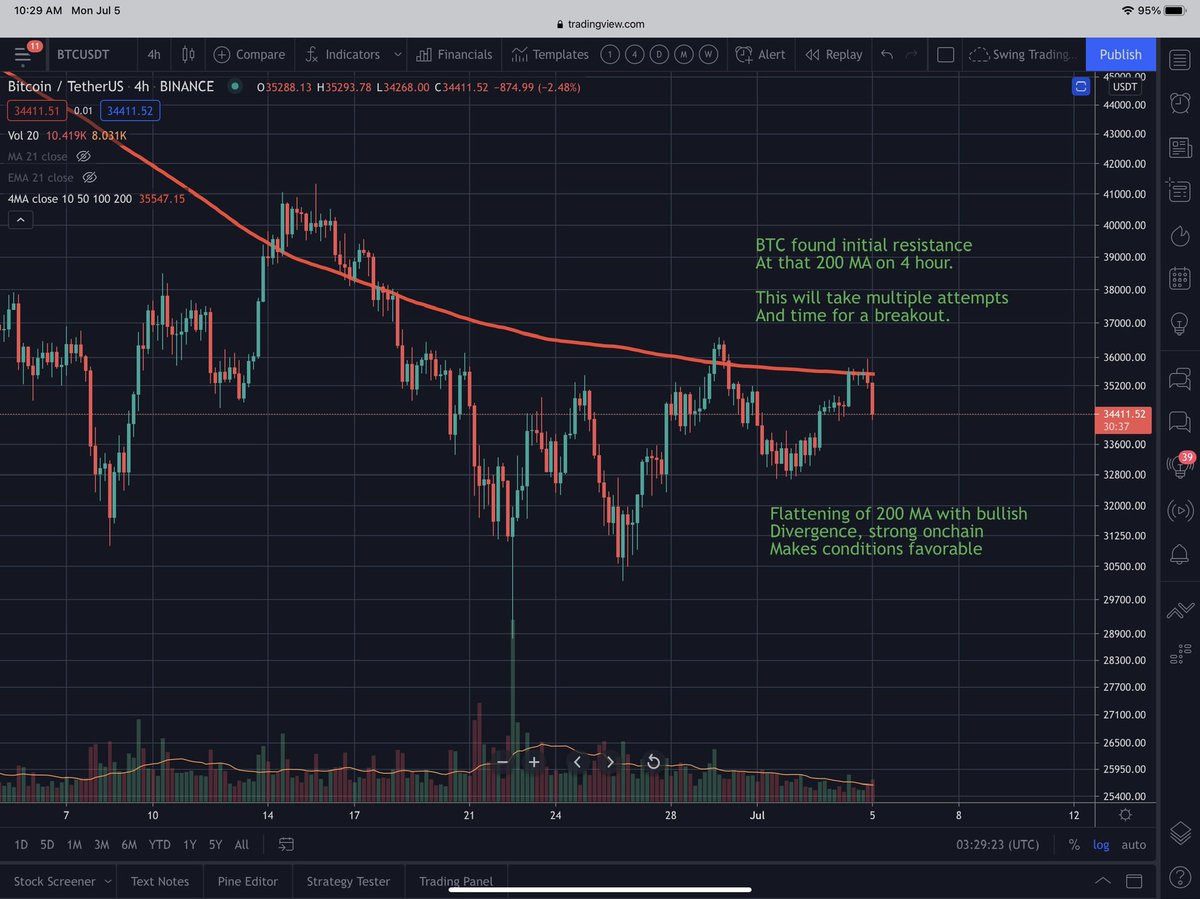
It appears #BTC is finding near term resistance at the 200 MA on the 4 hour chart. The 200 MA has been slowly flattening, signaling consolidation has been progressing and a potential set up for an attempt to push higher. (Chart from yesterday’s initial test)

It is very important for BTC to hold the Higher Low at 32.7k. If #BTC closes below 32.7k, this will signal downside risk to 30k near term.
I am tracking a near term uptrend support line with support around 34.1k. I would like to see #BTC bounce off this uptrend support line and push higher and close above 35.5k and 36.6k.
There is a near term ascending triangle forming for #BTC. This pattern has a 63% probability of breaking out to the upside. Factor in #bullish divergence on the daily chart, with the higher lows being made, improving momentum, it looks favorable for a push higher.

Long term charts:
I recommend reading my #thread on my 21/40 Rule for long term charts here:
I recommend reading my #thread on my 21/40 Rule for long term charts here:
https://twitter.com/DanielJoe916/status/1406313092301004801
In summary, as long as #BTC avoids the bearish crossover where the 21 week crosses below the 40 week, we should see bullish continuation. Near term, we need to see the Higher Low at 32.7k hold, and then close above 36.6k. Daily chart is showing bullish divergence...
Momentum is improving, Onchain continues to show strong accumulation as LTHs continue to absorb supply. As @WClementeIII and @woonomic showed in their analysis, this should lead to a SUPPLY SHOCK. Patience.
That’s the weekly update everyone! Stay tuned for daily updates. If you like my analysis, feel free to share it with the community 👍
• • •
Missing some Tweet in this thread? You can try to
force a refresh


