Sliding downwards to 165 total cases per day for the whole state over the last 14 days.

1.87 total cases per county per day.
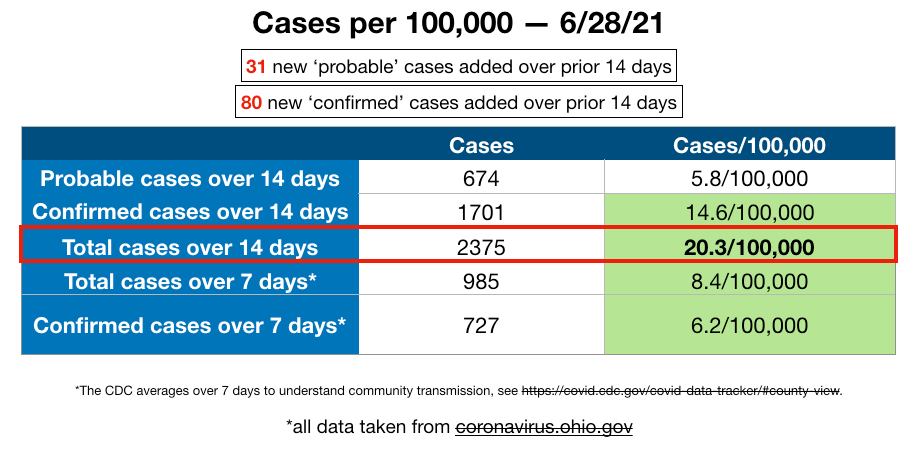
We are now at 96 confirmed cases per day over the last 7 days, just 1.09 cases per county per day.
Can I just point out how silly this is? Are we really masking so much harder (my eyes tell me that even in the eastern suburbs of Cleveland that there are fewer and fewer masks around).
Are they trying to claim in these last hot, muggy and rainy Ohio summer days people aren't in air conditioned spaces with others? And if they want to claim that it's the number of Vs, well then, that's great!
Because if they have such an effect already, then there's no reason to try and coerce people into getting it.

#InThisTogetherOhio

• • •

Missing some Tweet in this thread? You can try to force a refresh
 

Keep Current with Beyond the Data, with Kathryn Huwig.

Beyond the Data, with Kathryn Huwig. Profile picture

Stay in touch and get notified when new unrolls are available from this author!

Read all threads

This Thread may be Removed Anytime!

PDF

Twitter may remove this content at anytime! Save it as PDF for later use!

Try unrolling a thread yourself!

how to unroll video
  1. Follow @ThreadReaderApp to mention us!

  2. From a Twitter thread mention us with a keyword "unroll"
@threadreaderapp unroll

Practice here first or read more on our help page!

More from @ohio_data

2 Jul
So some really fascinating misinformation today - we've had a huge 'jump' in newly reported cases! Nearly TRIPLED! Everybody panic!! And they're nearly all confirmed cases! Double panic!
Must be that new Delta variant, right?
Or maybe the brand new 4th of July variant? Image
But the media tells us it must be bad!
(vindy.com/.../daily-covi…)
Well, interestingly enough, our new probable cases added in the last 14 days is only 19 more than yesterday's (71 vs 53) and the total new confirmed cases increased by just 1 from yesterday to today (139 to 140). Image
Read 9 tweets
2 Jul
We've recently heard about how it's the unV'd that are now testing positive in the hospital, with a scary % given to us. But what does it mean? How many are there in the hospital? And how do we get a good perspective on it?

Well, good news, I've become a data hoarder. Image
Attached, please find direct comparisons of how many COVID+ patients are/were in the hospital, how many non-COVID patients and how many empty beds there were for each of the eight regions (map showing what each region is is also attached).
The top graph is from 12/28/20 and includes the absolute height of COVID+ hospital occupancy. The lower graph is from yesterday, June 30th.
Read 11 tweets
30 Jun
Tuesday's new reported data again shows a bump in the near term probables. Right on time with the beginning of the work week. Purely coincidental, I'm sure.

We are now down to just 167 total cases per day for the whole state, just 1.90 total cases per county per day. Image
Confirmed cases in the last 7 days have also dropped to their lowest point, with just 98 confirmed cases per day.

⭐️ That's 1.11 cases per county per day. Image
Our new V-starts keep following the dropping trend - no wonder Gov. DeWine no longer wants to talk about COVID - there's nothing scary to report, and no good news about the Big V either. Image
Read 6 tweets
29 Jun
14 day cases continue to be down and we've switched back to day over day decreases in the 7 day case numbers, though we haven't returned to our lowest numbers again. Image
We are now looking at 170 total cases in the entire state per day, which equates to 1.93 cases per county per day over the last 2 weeks
Our confirmed cases over the last 7 days has dropped again to 104 cases per day for the entire state and 1.18 confirmed cases per county per day for the last 7 days.
Read 7 tweets
18 Jun
We are now down to 225 total cases per day over 14 days, or just 2.56 cases per county per day.

When we get down to confirmed cases over a week's span, we're down to just 119 cases per day, or 1.35 cases per county per day.
Our V-starts also look like they have returned close to baseline declines after the opening of the Big V to 12-15 year olds.
Read 5 tweets
18 Jun
Apologies upfront for the complexity of this post today, but the delaying of the 'emergency' meeting regarding myocarditis in younger individuals is beyond shocking and irresponsible.
In this post I have attached my commentary directly to each of these images, please read each and consider them carefully.
This article details cases of myocarditis in younger men, in particular, following mRNA accines. Note the relative specificity of timing - usually within 4 days after the second dose.
Note the very high rate for individuals between 16-30 years of age.
Also note the date - 4/27/21
Read 21 tweets

Did Thread Reader help you today?

Support us! We are indie developers!


This site is made by just two indie developers on a laptop doing marketing, support and development! Read more about the story.

Become a Premium Member ($3/month or $30/year) and get exclusive features!

Become Premium

Too expensive? Make a small donation by buying us coffee ($5) or help with server cost ($10)

Donate via Paypal Become our Patreon

Thank you for your support!

Follow Us on Twitter!

:(