You might notice that the plots I post today look a little different from previous days. Here’s a thread about why that is, with a little bit on scientific communication, psychology and politics, and reflections on my own motivation.
I’ve previously posted plots in portrait format, because I figured a large proportion of views would be on phones. But some noted that Twitter lops off the top of graphs when plots are in RTs, making graphs look rather benign if the post wasn’t clicked on.
https://twitter.com/podehaye/status/1411610006399631363?s=20
So I tried making a landscape version, and asked people which version they preferred.
https://twitter.com/ProfColinDavis/status/1411727855311073283?s=20
There’s a clear preference for the landscape version, so I will switch to that. However, a third of respondents expressed a preference for the portrait version, and a few people commented that the landscape version didn’t seem as troubling (and would be preferred by the govt!).
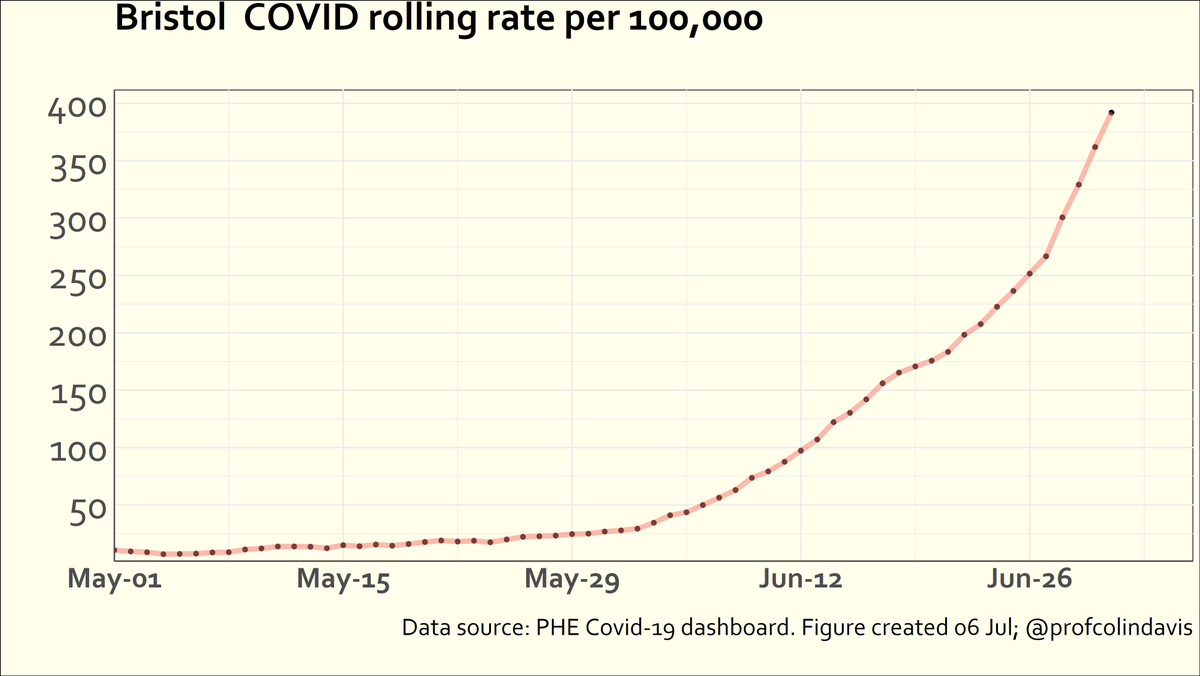
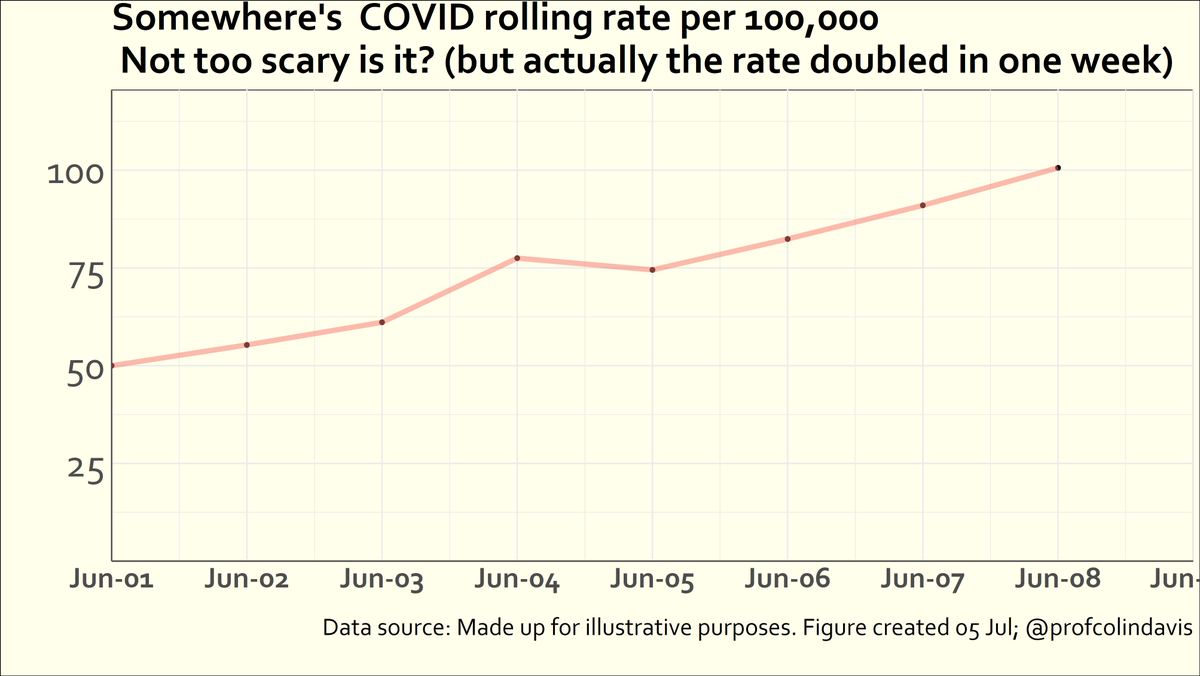
There are a couple of important points here. First, there’s a problem with stretching a short time frame over the longest dimension and squeezing an outcome variable that varies by a factor of 32 or 64 (5 or 6 doublings) into the shorter dimension. Here’s an illustrative example. 
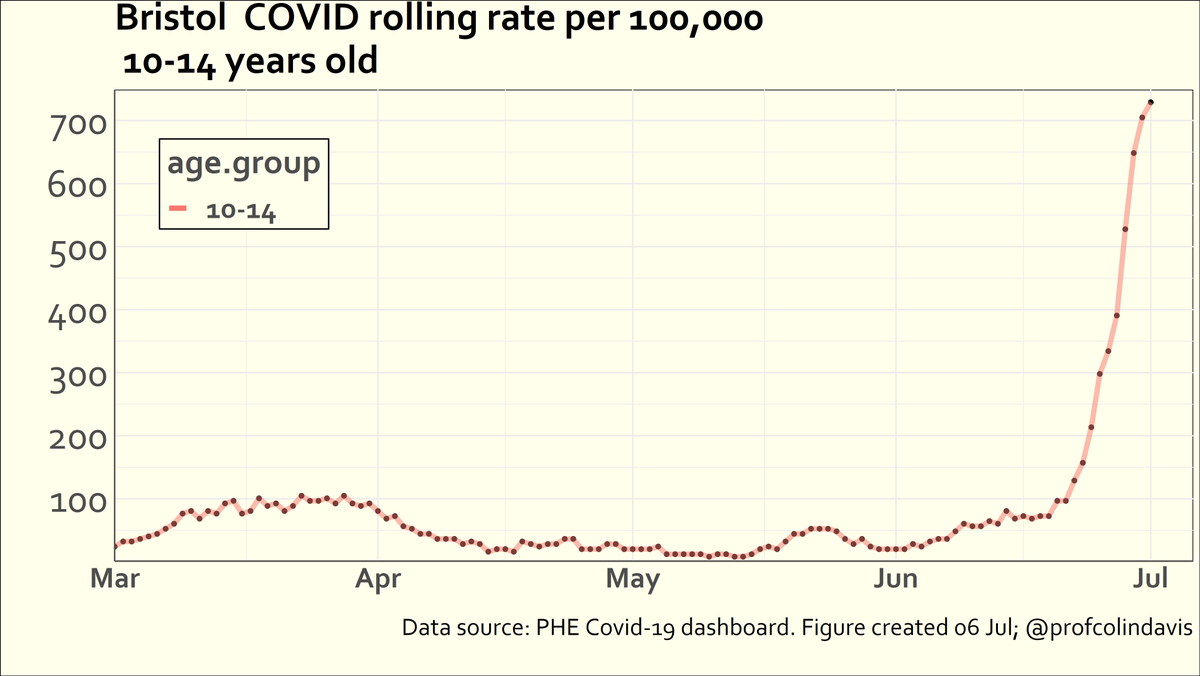
On reflection, I think the right way to deal with this problem is to show longer time frames in the plot, as in this one. March seems like a good starting point, given that’s when schools reopened for most children.

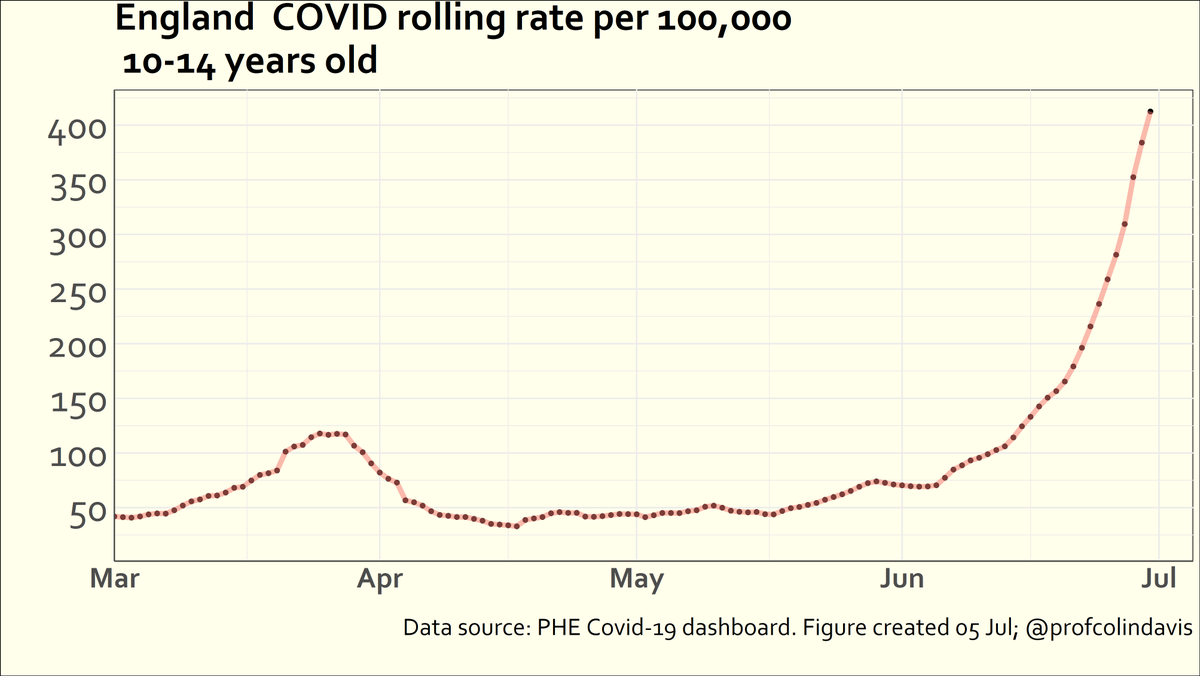
But one could start from the beginning of 2021, which allows the viewer to see the previous peak for 10-14 year olds (which we’ve now exceeded). I was going to say something else about the shape of this graph, but maybe I’ll leave that to someone else.

Or one could start from the beginning of the school year, in Sept 2020, which allows the viewer to see the whole second wave (and note that previous variants *did* cause lots of infections in children, and the rate changes correlated with schools opening/closing).

Arguments can be made for all these versions, but my goal is to show what’s happening now, so I don’t want to squash the last month too much. For an overview of how rates have changed across age groups over the last year, the heat map on the dashboard is a very effective plot.

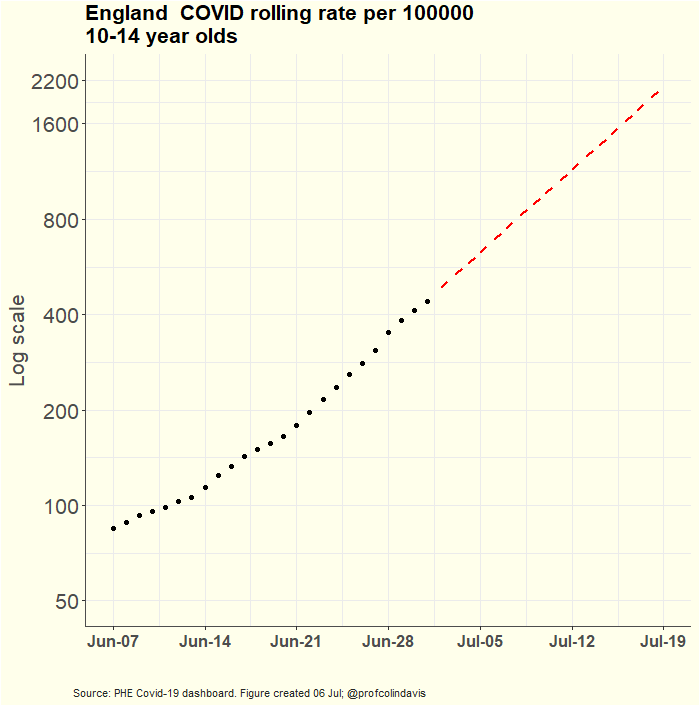
Second, changing the format (portrait/landscape) and the axes has a big impact on how steep the curves are, and hence how “scary” they look, which brings with it a certain moral hazard. You should always ask yourself, “who’s making this graph, and what is their intent?”
If you’re interested in the cognitive psychology underlying perception of graphs, my colleague @STWorg Stephan Lewandowsky has done some interesting work, including experiments investigating the (ab)use of graphs as a tool for misinformation.
As for myself, I’m a scientist, and it’s important to me that the data are portrayed in a way that’s fair, and not misleading. It isn’t my intention to sensationalise or dramatize what’s going on. As in other areas of life, it’s important to #TellTheTruth
At the same time, it’s hard to avoid there being a political element to these graphs, especially at a time when there’s so much polarisation. When MPs argue that we should no longer even publish the data, posting these plots is itself a political act.
https://twitter.com/BBCPolitics/status/1410184735834390534?s=20
Though I’m a scientist, I don’t subscribe to the view that I should therefore be a neutral observer. I’ve been posting plots since the pandemic started, but not the whole time – I start posting plots when exponential growth becomes clear. I do that to make sure people are aware.

And every time, I do that for a while, with little evidence anyone’s paying attention, and life going on as if everything’s fine. Eventually I get so frustrated by that I can’t help ranting/shouting into the void. Here’s a recent example.
https://twitter.com/ProfColinDavis/status/1409565222919192594?s=20
In previous waves I’ve lost enthusiasm for posting plots once it’s clear to everyone what’s happening – I’m more interested in warning people about what’s coming than documenting bad things as they happen. (I’ll go back to talking about the climate and ecological emergencies).
So I’ll probably give up on these plots again soon, as we move from “there won’t be another wave” to “surf’s up, who cares?” But I won’t have lost my anger at a government that shows such contempt for its citizens (esp the most vulnerable) and an “opposition” that cheers them on.
• • •
Missing some Tweet in this thread? You can try to
force a refresh