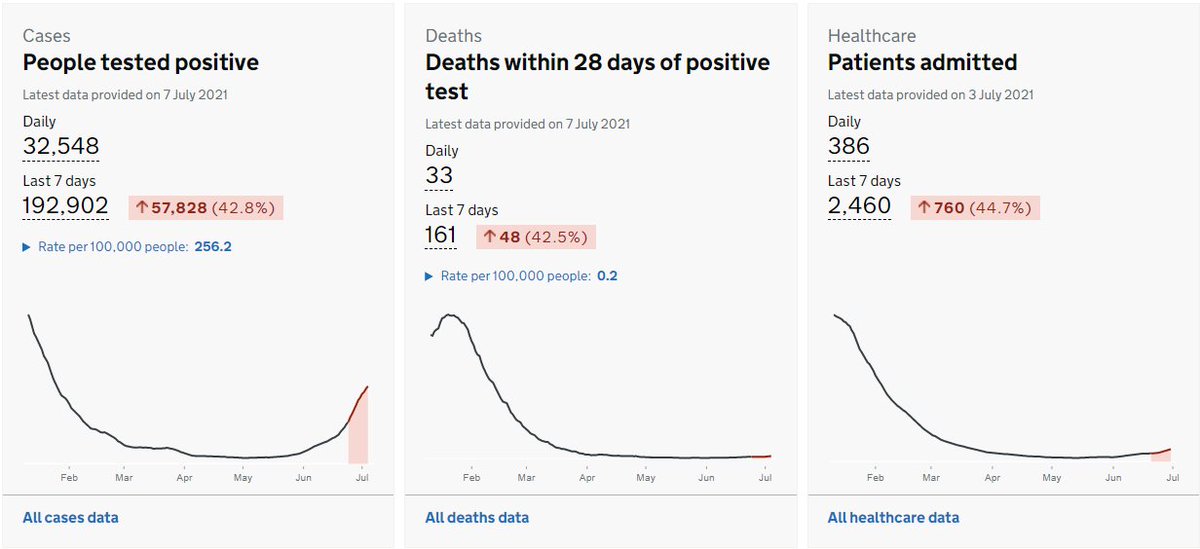
There’s plenty of bad news on the dashboard this evening, with hospitalisations and deaths joining cases in growing by over 40% week-on-week. But is it just me, or does that case curve look like it’s starting to curve over to the right?
Of course, this will be no surprise to anyone who’s been paying attention to the age-stratified growth rates over the last week. And the pattern here continues, with growth rates continuing to fall in the under-30s:
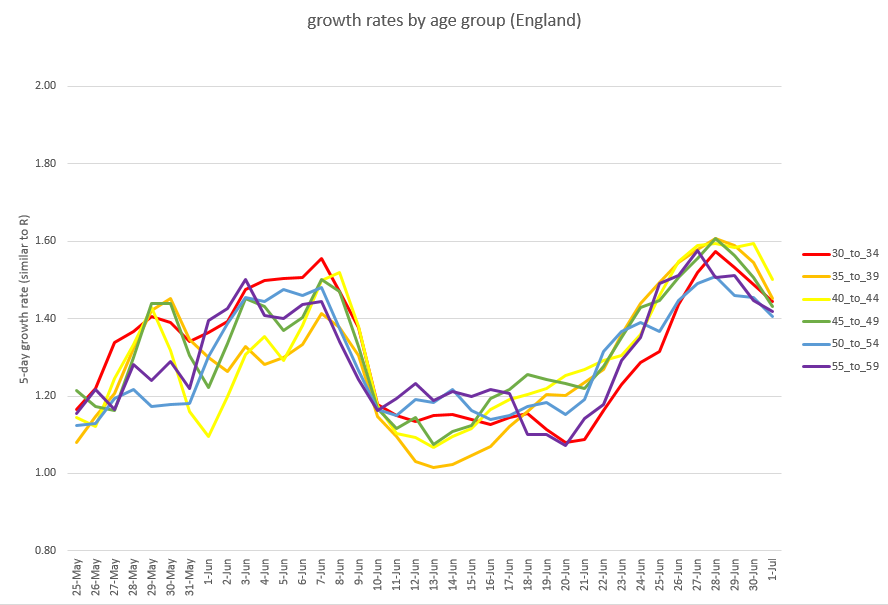
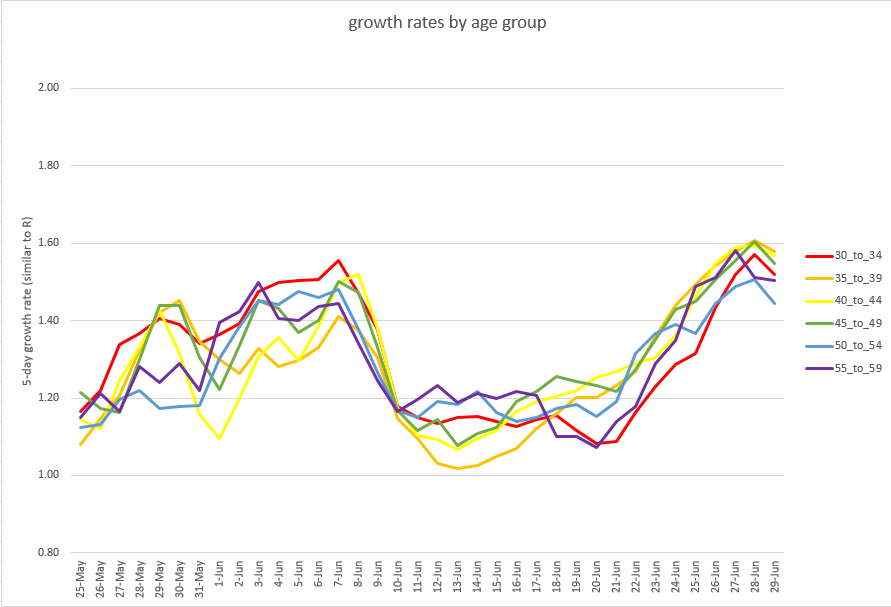
and in the 30-60s:
However the trend in the 60-90s is less good, with (on average) flat growth levels, still too high (c. 50% over 5 days) – and the growth in this group is now higher than in the under-60s. That’s not good news for the trend in admissions and deaths over the next 2-3 weeks
Also please note that we’re currently seeing high levels of late cases being reported. This means that the last 1-2 days of my graphs might be under-estimating growth. I don’t think it will change the direction, but it might just adjust the slope.
If we look at the overall (all ages) growth, there is a clear trend, and it’s possible to get excited: another week or so on that line and we’d be at R=1 (i.e. cases peaking). I think that’s probably too optimistic; the trend looks too strong to be a pure vaccine effect,
… and so there’s probably other factors involved – and there’s also still a lot of variation by age group and by region, all of which makes it hard to call whether growth continues down, finds a new level or bounces back up. But at least it’s going in the right direction. /end

• • •

Missing some Tweet in this thread? You can try to force a refresh
 

Keep Current with James Ward

James Ward Profile picture

Stay in touch and get notified when new unrolls are available from this author!

Read all threads

This Thread may be Removed Anytime!

PDF

Twitter may remove this content at anytime! Save it as PDF for later use!

Try unrolling a thread yourself!

how to unroll video
  1. Follow @ThreadReaderApp to mention us!

  2. From a Twitter thread mention us with a keyword "unroll"
@threadreaderapp unroll

Practice here first or read more on our help page!

More from @JamesWard73

8 Jul
As usual, Monday’s modelling thread produced some excellent questions, and apologies that I wasn’t able to answer all of them. But as a small corrective, I’d like to offer answers now to four of the most common / relevant questions, in a short thread:
Q1: what happens if you vaccinate teenagers? As it happens I did look at this, but ran out of time & space to give you the results on Monday. The short answer is that it doesn’t make much difference to the model results, because I’m assuming that...
…(as per @PaulMainwood analysis) we don’t have enough mRNA supply to vaccinate more than a small % of teenagers before September, and by then the summer wave is mostly over. The one exception is in the scenario (below) where we delay opening…
Read 11 tweets
8 Jul
This is my new favourite graph of the week: case growth rates down (or roughly flat) over the last week in nearly every age group. There’s just one fly in the ointment: rising growth in the 90+, which is not the group I would choose for that pattern. Image
Here’s the more familiar graphs by age group, starting with the 0-30s: Image
then the 30-60s: Image
Read 9 tweets
5 Jul
I’m not going to do a very long model update thread, because it’s a busy week at work and I do actually need to get some sleep at some point. But I thought you might appreciate some headline conclusions from the latest version, as it might help inform the debate re. 19 July 1/n
I’m also not going to give you a policy recommendation, because it’s a genuinely tough call, and as usual I’m going to take it to the wire before getting off the fence (and I’ll stop the mixed metaphors there, before I do myself a nasty – if imaginary – injury). 2/n
So as usual I’ve updated to all the latest data and made a few other adjustments in an attempt to get as close as possible to a genuine “central view” i.e. as likely to be wrong on the upside as the downside. This week, those changes have included: 3/n
Read 18 tweets
4 Jul
A quick Sunday case data round-up. First, the age-group growth rate charts continue to show a declining trend in short-term growth. I’ll start with the 0-30s today:
and then the 30-60s, also with a clear declining trend:
and lastly the 60-90s, now mostly holding at a fairly steady growth rate (which is better than where they were a few days ago, with accelerating growth). (ctd)
Read 7 tweets
2 Jul
I know the cases and admissions data looks bad again today, but I’m going to stick my neck out and say: I think we might have passed the current peak of growth rates, and so R could be about to head down again. Here’s the recent growth trends in the 30-60 year olds: 1/
And here’s the same graph for the 0-30s: 2/
The trends in the older age groups (60-90) are less good – but *if* we think a lot of these cases are direct infections from younger people, then we’d expect these curves to follow the shape of the younger groups, just a bit behind. So if those come down, these should too. 3/
Read 4 tweets
1 Jul
Today we got @PHE_uk’s latest weekly surveillance report which provides their age-stratified hospital admissions data. I can use this to extend my analysis of the hospitalisation ratio, as follows:
This shows that in the most recent week (admissions in 21-27 June), the ratio has dropped further, to around 1.5%. I can also extend my “fixed age mix” curve, in orange (see thread below for explanation of this) – which has dropped by a similar amount.
This implies that the most recent drop is “real” i.e. it’s caused by falls in hospitalisation ratios *within* each age group, not by changes in the age mix of cases. We can see this if we look at the hospitalisation ratios for each age group, as per the chart below:
Read 10 tweets

Did Thread Reader help you today?

Support us! We are indie developers!


This site is made by just two indie developers on a laptop doing marketing, support and development! Read more about the story.

Become a Premium Member ($3/month or $30/year) and get exclusive features!

Become Premium

Too expensive? Make a small donation by buying us coffee ($5) or help with server cost ($10)

Donate via Paypal Become our Patreon

Thank you for your support!

Follow Us on Twitter!

:(