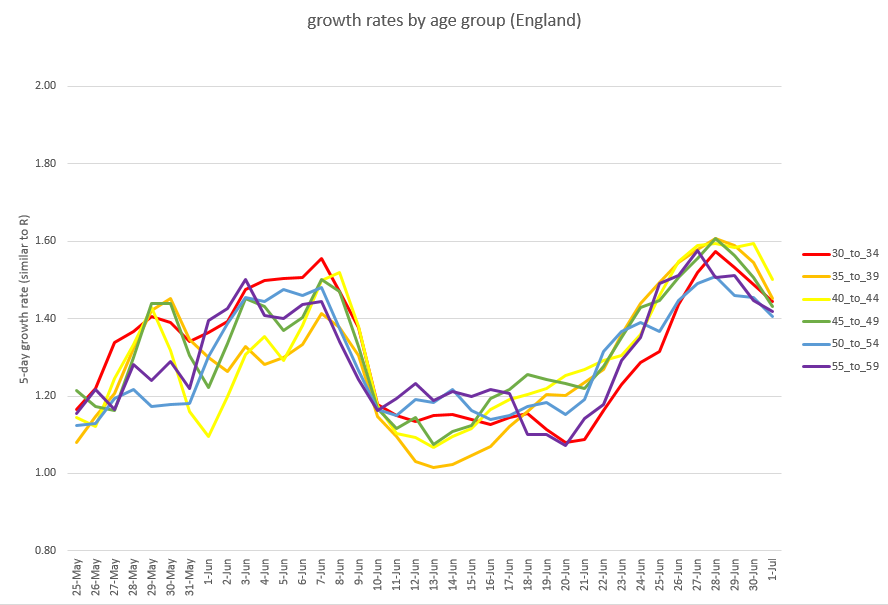
This is my new favourite graph of the week: case growth rates down (or roughly flat) over the last week in nearly every age group. There’s just one fly in the ointment: rising growth in the 90+, which is not the group I would choose for that pattern.
Here’s the more familiar graphs by age group, starting with the 0-30s:
then the 30-60s:
And finally the 60-90s, who are now (thankfully) showing clearer signs of slower growth in most groups. (although, as before, there’s a risk that delayed test reporting might be exaggerating the effect on the most recent day or two)
If we look at the raw case data for the 20-24s (the group with the highest case rates, and in late May /early June the highest growth as well), there’s an intriguing sign that we may already be at the peak of cases (not just peak of growth). 🤞
Of course there’s still plenty of ways for this to go wrong (not least with the football ongoing), but so far I’m encouraged by this. I’m also intrigued by what exactly is pulling the growth rates down. I’d love to believe it’s a herd-immunity effect, led by the 20-24s…
…where we may finally have reached a “wall” caused by the combined pressure of vaccinations and prior infections (and perhaps assisted by heterogenous mixing effects). But that wouldn’t explain why growth peaked at the same time in nearly every age group…
…and also in nearly every region (which you wouldn’t expect, if this was mainly driven by immunity). That synchronicity points to a more external driver e.g. a behavioural reaction to a government announcement (but what??) or the weather. Views welcome….
apologies - have just realised that chart was mislabelled, it's actually the weekly growth (with 0.6 meaning 60% growth, for example), not the 5-day growth rate. but the point was more about the synchronised peak not the values on the y-axis, so will leave it there.
• • •
Missing some Tweet in this thread? You can try to
force a refresh
So it’s time for me to come off the fence re 19th July. I’m in favour of:
a) Opening up on 19/7, but with stronger mitigating baseline measures than the govt is proposing
b) Opening up vaccinations to 12-17s as supply permits, starting with the vulnerable.
Long🧵follows...
I’m very conscious that many people will disagree with something I’ve said there, and possibly all of it. And I have good friends on all sides of these debates, who I don’t want to lose. So it may help to say: just because you oppose (or support) vaccination of teenagers…
…doesn’t mean that I think you’re a psychopath. And just because you might support extending regulations for another few weeks, doesn’t mean I think you’re a “bedwetter”, or uncaring about those who have suffered during lockdown. So I’d be grateful if you…
and if you prefer to look at the case data instead of growth rates, here it is:
and if you just prefer numbers, here are two to consider:
- England cases in 20-24 age group, specimen date 28th June: 4510
- same figure 7 days later, on 5th July: 4548
(and yes, I know there could still be some late tests reported for that date tomorrow or thereafter)
As usual, Monday’s modelling thread produced some excellent questions, and apologies that I wasn’t able to answer all of them. But as a small corrective, I’d like to offer answers now to four of the most common / relevant questions, in a short thread:
Q1: what happens if you vaccinate teenagers? As it happens I did look at this, but ran out of time & space to give you the results on Monday. The short answer is that it doesn’t make much difference to the model results, because I’m assuming that...
…(as per @PaulMainwood analysis) we don’t have enough mRNA supply to vaccinate more than a small % of teenagers before September, and by then the summer wave is mostly over. The one exception is in the scenario (below) where we delay opening…
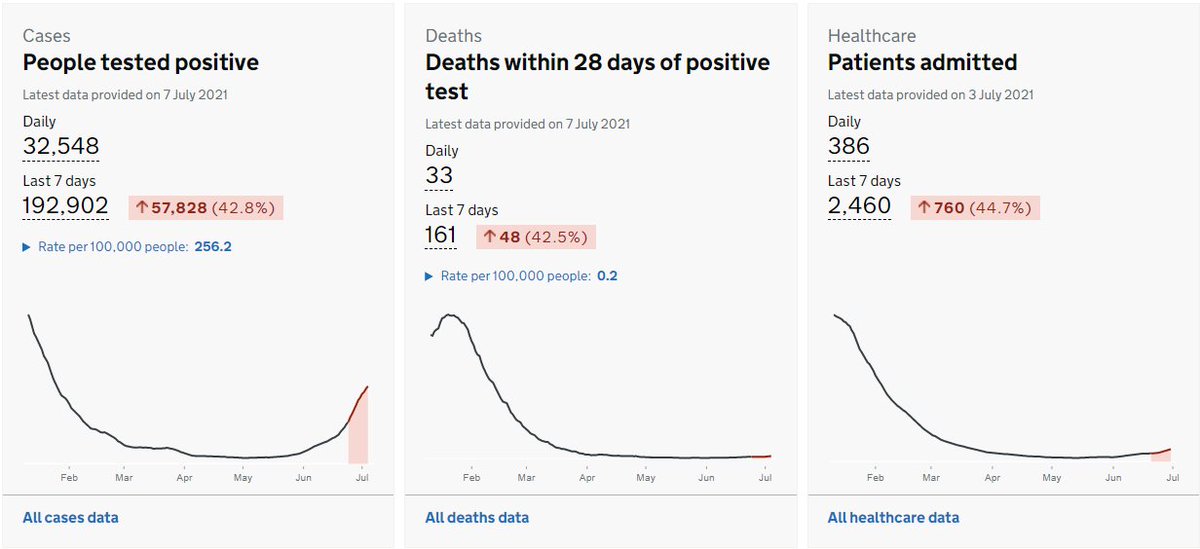
There’s plenty of bad news on the dashboard this evening, with hospitalisations and deaths joining cases in growing by over 40% week-on-week. But is it just me, or does that case curve look like it’s starting to curve over to the right?
Of course, this will be no surprise to anyone who’s been paying attention to the age-stratified growth rates over the last week. And the pattern here continues, with growth rates continuing to fall in the under-30s:
I’m not going to do a very long model update thread, because it’s a busy week at work and I do actually need to get some sleep at some point. But I thought you might appreciate some headline conclusions from the latest version, as it might help inform the debate re. 19 July 1/n
I’m also not going to give you a policy recommendation, because it’s a genuinely tough call, and as usual I’m going to take it to the wire before getting off the fence (and I’ll stop the mixed metaphors there, before I do myself a nasty – if imaginary – injury). 2/n
So as usual I’ve updated to all the latest data and made a few other adjustments in an attempt to get as close as possible to a genuine “central view” i.e. as likely to be wrong on the upside as the downside. This week, those changes have included: 3/n
A quick Sunday case data round-up. First, the age-group growth rate charts continue to show a declining trend in short-term growth. I’ll start with the 0-30s today:
and then the 30-60s, also with a clear declining trend:
and lastly the 60-90s, now mostly holding at a fairly steady growth rate (which is better than where they were a few days ago, with accelerating growth). (ctd)