As usual, Monday’s modelling thread produced some excellent questions, and apologies that I wasn’t able to answer all of them. But as a small corrective, I’d like to offer answers now to four of the most common / relevant questions, in a short thread:
https://twitter.com/JamesWard73/status/1412182736572399623?s=20
Q1: what happens if you vaccinate teenagers? As it happens I did look at this, but ran out of time & space to give you the results on Monday. The short answer is that it doesn’t make much difference to the model results, because I’m assuming that...
…(as per @PaulMainwood analysis) we don’t have enough mRNA supply to vaccinate more than a small % of teenagers before September, and by then the summer wave is mostly over. The one exception is in the scenario (below) where we delay opening… 

to September, and my assumptions are proved badly wrong (on the downside) so we get a second autumn wave, then the teenage vaccinations can have a material impact – see below 

BUT that’s not to say we shouldn’t do it, and this is one area that I’d be particularly cautious in using my model to drive a policy recommendation, because it’s not fully age-stratified, and I could easily imagine getting a different result from a more sophisticated model.
Q2: what’s the split of vaccinated and unvaccinated in those who end up in hospital? The answer is it’s about 40% unvaccinated, and 60% vaccinated (with at least 1 dose). This varies a bit by age group – it’s more like 25% unvaxxed in the over-70s, and 80% in the under-50s.
This is a very predictable consequence of the assumptions on vaccine take-up and the effectiveness (vs. severe disease) of the vaccines - and the variation by age group or JCVI category is due to different assumptions on vaccine take-up in the different groups.
Q3: how many people are infected / hospitalised in your exit wave? Roughly speaking, the exit wave in the central case has about 5.7m infections, and 90k hospitalisations. At peak, we’re looking at around 750k infections (and 12k hospitalisations) in a week….
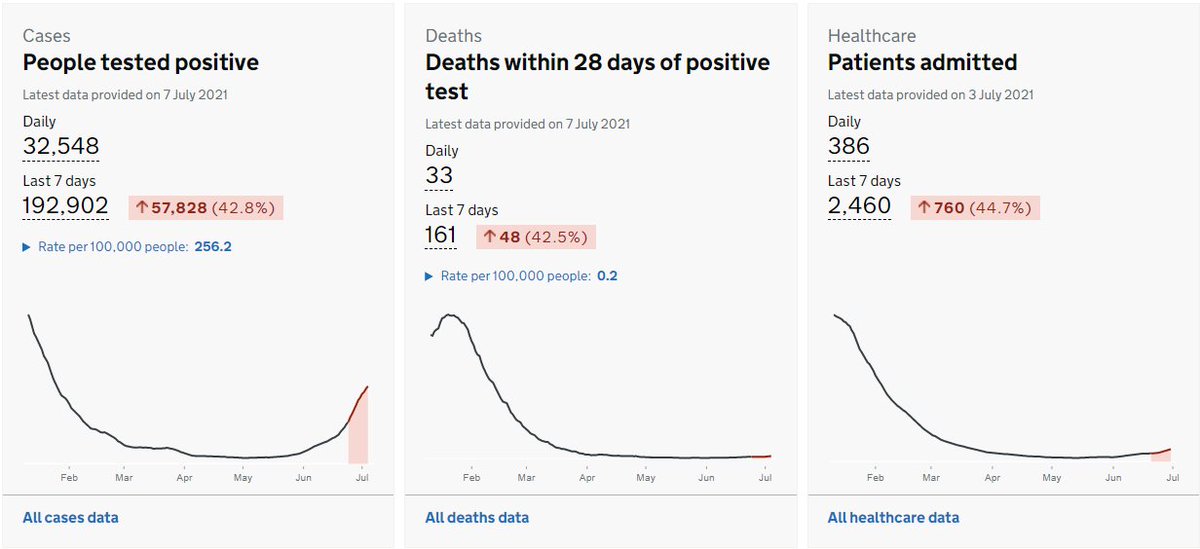
….so just over 100k infections per day (and just under 2k hospitalisations per day). Allowing for the fact that we don’t record all infections as cases, that’s maybe 50-60k cases per day. And a shade over 2% prevalence at the peak, which would be similar to January.
Q4: what does your model say about Long Covid? The short answer is “not much” because I haven’t tried to model it – but that doesn’t mean I don’t think it’s real or important, just that I haven’t had time yet to study the data closely enough to decide on a model parameter.
If you have a view on how many people (as a % of infections) are likely to have ongoing symptoms of a particular type or severity, then you can multiply that by the infection figure I’ve given above to estimate the number of sufferers arising from the exit wave. /end
• • •
Missing some Tweet in this thread? You can try to
force a refresh


