So here's a thought experiment as we watch the v-starts continue to fall with no sign of any increased interest from those who have yet to take it.
It has been put out there in the new models that having 68% of people injected is a 'low' coverage number for their calculations, while 83% (for the moment) is their goal.
But what does that mean in terms of how long it will take at our current rate of V-uptake?
According to the state of Ohio's website as of 7/6/21, there have been 5,598,761 Ohioans who have taken the first dose out of the 11,689,100 total population number that they have been using through the pandemic.
Assuming that every single person who has taken their 1st dose, takes the 2nd dose (something we know isn't true, but it gives us a lower boundary) we can make the following chart using the average weekly rate over the last 4 weeks & the number of started doses in the last week.
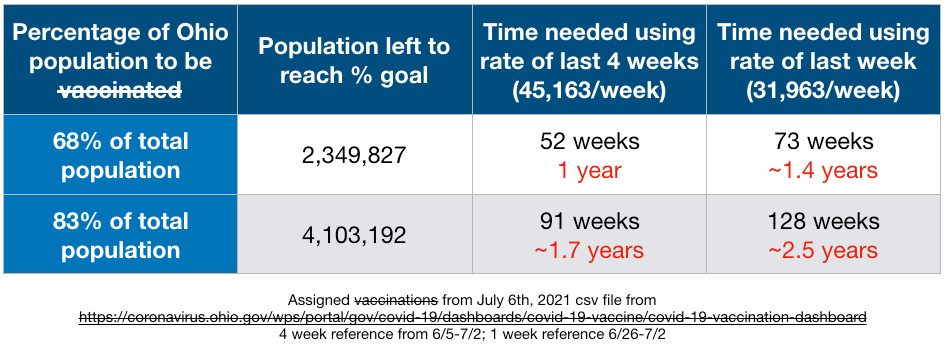
It is clear to see that it is not feasible at the current rate to get to their targets, so either they will suddenly remember that there's such a thing as natural immunity (hah!) or they will start getting increasingly more aggressive with the coercive tactics already begun.
We already have heard from Pres. Biden the first inklings of which direction they are planning to go.

Which route do you think Gov. DeWine will take?

#InThisTogetherOhio
#ImpeachDewine

• • •

Missing some Tweet in this thread? You can try to force a refresh
 

Keep Current with Beyond the Data, with Kathryn Huwig.

Beyond the Data, with Kathryn Huwig. Profile picture

Stay in touch and get notified when new unrolls are available from this author!

Read all threads

This Thread may be Removed Anytime!

PDF

Twitter may remove this content at anytime! Save it as PDF for later use!

Try unrolling a thread yourself!

how to unroll video
  1. Follow @ThreadReaderApp to mention us!

  2. From a Twitter thread mention us with a keyword "unroll"
@threadreaderapp unroll

Practice here first or read more on our help page!

More from @ohio_data

7 Jul
I've made comments previously about how 'respectful' this virus is of our holidays both before the weekend and now after -
- for those of you who haven't been following me for the long term, I think I should re-clarify what I mean by its 'respect' & why it is so important in understanding the actual danger of this virus in terms of true illness and not just people testing positive with no ill effect.
Obviously, the virus isn't actually 'respectful' - it's a virus. Holidays and weekends are meaningless when it comes to illness. You get sick when you get sick whether it's a holiday or not.
Read 16 tweets
5 Jul
It's a bit of a short bit of (mis)information today since cases aren't reported on holidays, but V information never takes a break! So here you go, today's V data, telling us the same story of those who want it, have taken it, and those that don't are not convinced. Image
I have also added a bonus graph today - one showing v-starts by reported date (blue line) and v-starts by assigned date (orange line). I haven't taken the time to actually analyze the area under the curve, but - Image
- just from eyeballing it, particularly in the last month, there have been significantly more reported v-starts than those assigned. Image
Read 4 tweets
2 Jul
So some really fascinating misinformation today - we've had a huge 'jump' in newly reported cases! Nearly TRIPLED! Everybody panic!! And they're nearly all confirmed cases! Double panic!
Must be that new Delta variant, right?
Or maybe the brand new 4th of July variant?
But the media tells us it must be bad!
(vindy.com/.../daily-covi…)
Well, interestingly enough, our new probable cases added in the last 14 days is only 19 more than yesterday's (71 vs 53) and the total new confirmed cases increased by just 1 from yesterday to today (139 to 140).
Read 9 tweets
2 Jul
We've recently heard about how it's the unV'd that are now testing positive in the hospital, with a scary % given to us. But what does it mean? How many are there in the hospital? And how do we get a good perspective on it?

Well, good news, I've become a data hoarder.
Attached, please find direct comparisons of how many COVID+ patients are/were in the hospital, how many non-COVID patients and how many empty beds there were for each of the eight regions (map showing what each region is is also attached).
The top graph is from 12/28/20 and includes the absolute height of COVID+ hospital occupancy. The lower graph is from yesterday, June 30th.
Read 11 tweets
1 Jul
Sliding downwards to 165 total cases per day for the whole state over the last 14 days.

1.87 total cases per county per day.
We are now at 96 confirmed cases per day over the last 7 days, just 1.09 cases per county per day.
Can I just point out how silly this is? Are we really masking so much harder (my eyes tell me that even in the eastern suburbs of Cleveland that there are fewer and fewer masks around).
Read 5 tweets
30 Jun
Tuesday's new reported data again shows a bump in the near term probables. Right on time with the beginning of the work week. Purely coincidental, I'm sure.

We are now down to just 167 total cases per day for the whole state, just 1.90 total cases per county per day. Image
Confirmed cases in the last 7 days have also dropped to their lowest point, with just 98 confirmed cases per day.

⭐️ That's 1.11 cases per county per day. Image
Our new V-starts keep following the dropping trend - no wonder Gov. DeWine no longer wants to talk about COVID - there's nothing scary to report, and no good news about the Big V either. Image
Read 6 tweets

Did Thread Reader help you today?

Support us! We are indie developers!


This site is made by just two indie developers on a laptop doing marketing, support and development! Read more about the story.

Become a Premium Member ($3/month or $30/year) and get exclusive features!

Become Premium

Too expensive? Make a small donation by buying us coffee ($5) or help with server cost ($10)

Donate via Paypal Become our Patreon

Thank you for your support!

Follow Us on Twitter!

:(