I've had a little time to digest the WWA report on the Northwest heatwave:

worldweatherattribution.org/wp-content/upl…

The most striking thing to me isn't the headline numbers, it's this graph.

Basically, it says the heatwave was statistically "impossible". Let me elaborate...
The graph, shown above, looks at temperature patterns observed in the Pacific Northwest over the last 70 years and applies what is known as Generalized Extreme Value (GEV) theory to it.

The fit, shown in red, looks pretty reasonable. 2/
One of the features of GEV is that it sometimes predicts that a statistical system as a finite limit.

That occurs when the data presents a downward curving slope, as it does here. 3/
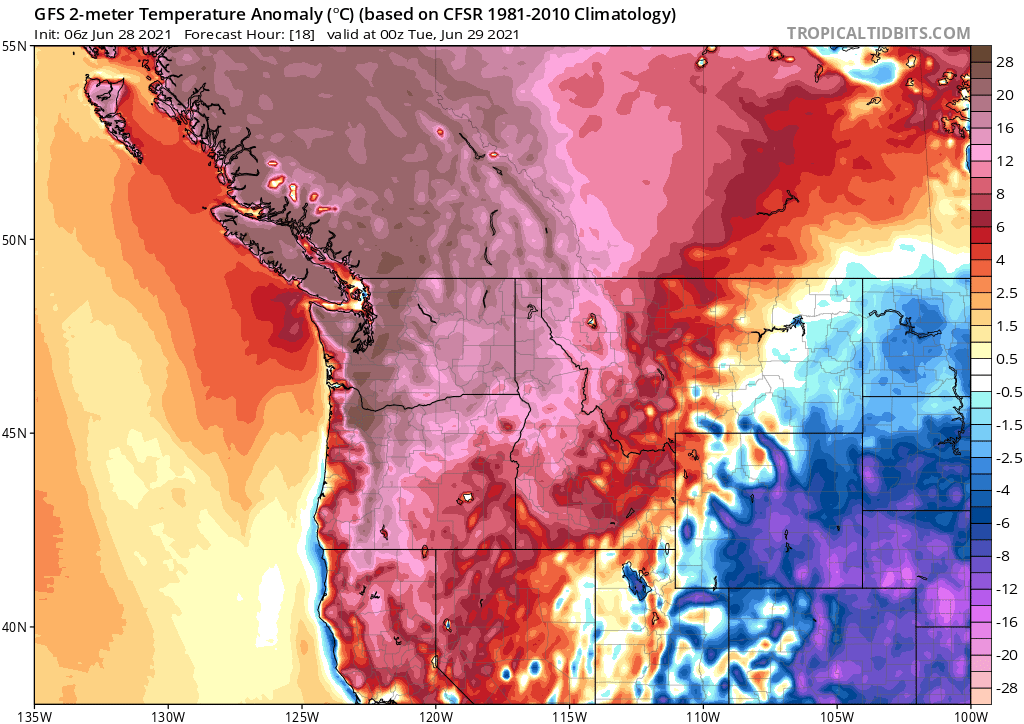
To be concrete, the analysis presented above says:

In the 70 years prior to 2021, the worst observed heatwave for the region corresponds to an average of ~35 °C (95 °F).

The GEV model estimates the worst possible is ~37 °C (99 °F).

But in 2021, we reached 39.5 °C (103 °F).

4/
The GEV model said that 39.5 °C was "impossible", but it happened anyway.

Now obviously, if it happened then it was actually possible, so what is it really telling us?

5/
It suggests that the 2021 heatwave may have had a qualitatively different origin or dynamics than all the other Pacific Northwest heatwaves of the last 70 years.

6/
That kind of thing happens sometimes with extremes in physical systems.

For example, 70 years of normal rain data may badly fail to predict how much rain is possible during a hurricane, because a hurricane is dynamically different from normal rain-producing processes.

7/
The statistics suggest that the Pacific Northwest heat storm was not merely more extreme than past events, but perhaps also qualitatively different.

So, *if* the event was qualitatively different from past events, then we ask in what way?

8/
The first option is that the heat storm was a proverbial hurricane, e.g. a rare dynamical interaction that has always been possible, but so rare that in 70 years of data we never observed a weather pattern that was qualitatively similar.

9/
The second option is that we are seeing unfamiliar dynamics because the climate system has changed at large scales in ways we don't yet fully understand.

I consider this the scarier option.

10/
Right now, we don't know the answer.

In all likelihood, entire PhDs will be written about the Pacific Northwest heat storm.

But nature has thrown us a scary curve ball, and we'll have to wait and see if this was just an exceedingly rare one-off or a sign of more to come.

11/11

• • •

Missing some Tweet in this thread? You can try to force a refresh
 

Keep Current with Dr. Robert Rohde

Dr. Robert Rohde Profile picture

Stay in touch and get notified when new unrolls are available from this author!

Read all threads

This Thread may be Removed Anytime!

PDF

Twitter may remove this content at anytime! Save it as PDF for later use!

Try unrolling a thread yourself!

how to unroll video
  1. Follow @ThreadReaderApp to mention us!

  2. From a Twitter thread mention us with a keyword "unroll"
@threadreaderapp unroll

Practice here first or read more on our help page!

More from @RARohde

28 Jun
One way to measure a heatwave is by how much temperatures have exceeded normal conditions.

By that metric, the heatwave in the Pacific Northwest has essentially tied, or possible even exceeded, the most severe summer heatwave ever observed anywhere in North America.
The previous graphic also helps to clarify why it is so shocking to have been seeing these weather models forecast temperatures +36 °F (+20 °C) above normal.

Historically, that essentially never happens, anywhere in North America during the summer months.
Yesterday, Portland International Airport reported 112 °F (44.4 °C) far exceeding any historical precedent.

That would be like Dallas reaching 130 °F (54 °C) or Madrid at 120 °F (49 °C).

Today, Portland is forecast to be even hotter at 114 °F (45.5 °C).
Read 8 tweets
14 Jun
❌ In a national referendum, Switzerland has repealed their local "CO₂ Law", rolling back the associated carbon tax, and severely undermining Swiss efforts to locally reduce carbon dioxide emissions.

A thread of some observations...

#CO2Gesetz
Firstly, the result. The referendum on the "CO₂ Law" was narrowly decided:

Support 1,568,036 (48.4%)
Repeal 1,671,150 (51.6%)

59.7% of voters participated which is very high for Switzerland.

2/
The repeal of the Swiss CO₂ Law makes it very likely that Switzerland will ultimately miss their stated goal of a 50% reduction in carbon dioxide emissions by 2030 relative to 1990 levels.

Under existing laws, only a bit more than 1/2 of this target reduction is expected.

3/
Read 19 tweets
2 Jun
Simple comparison between global mean temperature and carbon dioxide.

This is not the whole story of global warming, far from it, but it is a useful place to start. Overlapping time series chart showing the rise of global mea
Of course, correlation is not causation.

That's why physical understanding is needed.

We have understood for well over 100 years that carbon dioxide (CO₂) absorbs thermal radiation from the Earth's surface and contributes to the greenhouse effect.
The greenhouse effect is the process by which Earth's atmosphere captures and recycles energy from the Earth's surface.

This results in an Earth approximately ~30 °C (55 °F) warmer than one would expect without an atmosphere.
Read 4 tweets
3 May
Data visualization of the changes in land use types over last 12,000 years according to a recent paper by @erleellis and colleagues:

pnas.org/content/118/17…

Human actions have been transforming the Earth's surface for thousands of years.
A selection of time slices from the animation to further emphasize the shifts from uninhabited and sparsely inhabited land use type to more heavily populated and agricultural land uses.
The authors of the paper (with @EarthOutreach) have previously provided an online mapping tool for exploring the changes over time on local and regional scales.

anthroecology.org/anthromes/12kd…
Read 4 tweets
19 Mar
THREAD) The climate scientists consensus guide for who to follow on Twitter.

Need more climate information in your twitter feed?
Many suggestions are available in this thread

#FollowFriday #FF
There are literally thousands of scientists working on climate related issues who have joined Twitter.

@KHayhoe has created an excellent list of 3,148 such scientists, and if you want to get them all, you can follow her list directly.

twitter.com/i/lists/105306…

2/
The most popular, i.e. most followed, scientists working on climate issues are:

@KHayhoe
@MichaelEMann
@picazomario (mostly in Spanish)
@JacquelynGill
@PeterGleick
@hood_naturalist
@ClimateHuman
@KavehMadani (often in Farsi)
@ayanaeliza
@rahmstorf (often in German)

3/
Read 14 tweets
16 Mar
A year ago, when COVID was just taking off in many places, I never expected that China would actually end up as one of the least affected countries.
China's official COVID death toll stands at 4,636.

That's probably an undercount for several reasons, but even if the truth were twice as high it would still be a very low rate of death compared to most Western countries.
What China appears to have achieved early in the pandemic was the complete elimination of local transmission.

Few countries seriously tried to do this, and even fewer succeeded.
Read 6 tweets

Did Thread Reader help you today?

Support us! We are indie developers!


This site is made by just two indie developers on a laptop doing marketing, support and development! Read more about the story.

Become a Premium Member ($3/month or $30/year) and get exclusive features!

Become Premium

Too expensive? Make a small donation by buying us coffee ($5) or help with server cost ($10)

Donate via Paypal Become our Patreon

Thank you for your support!

Follow Us on Twitter!

:(