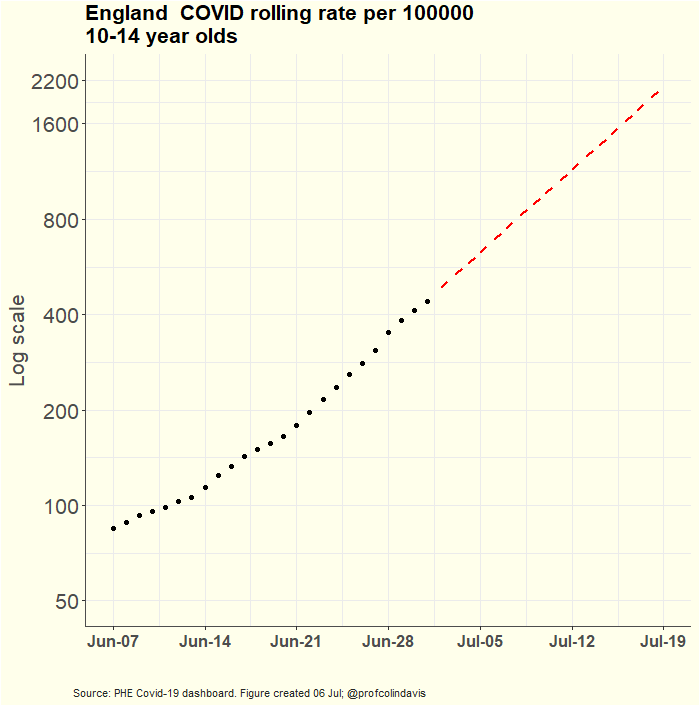
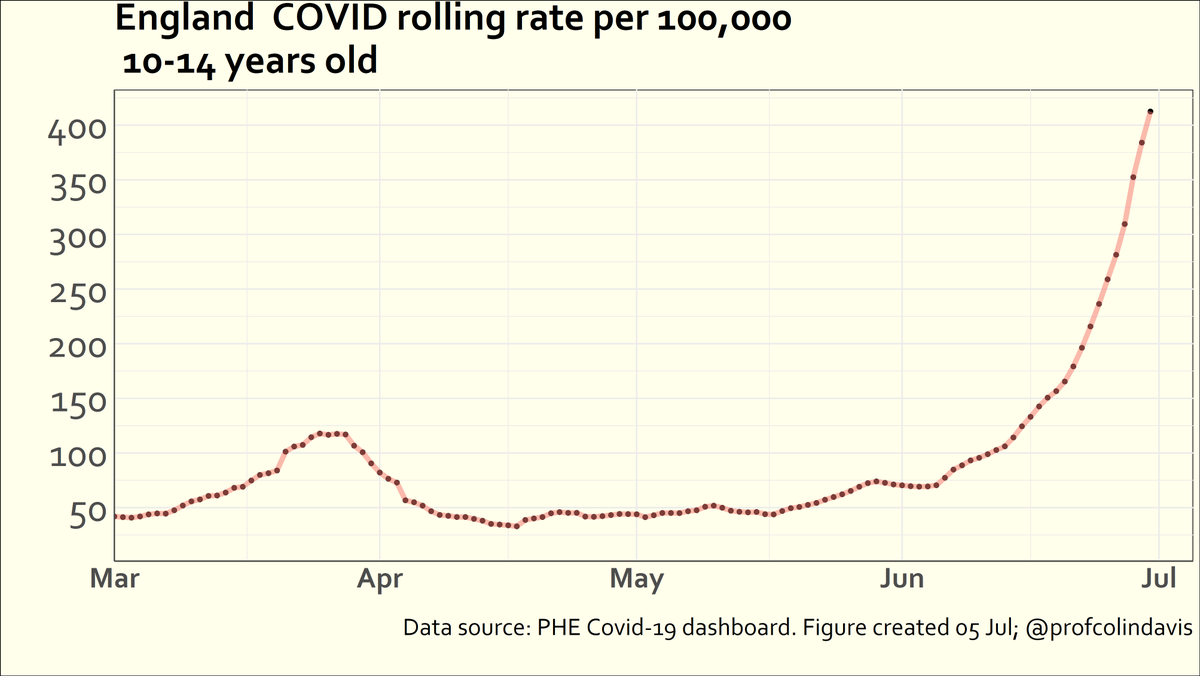
Here's an update to the chart showing the Covid rate for 10-14 year olds in England. Although it's still going up (over 500 per 100K now), it's definitely slowing down.
That slow down is most apparent on a log scale. As I said before, I'm not too surprised to see this happening when hundreds of 1000s of children are having to self-isolate (other explanations are available, of course).
Oldham continues to have the highest rate for 10-14 year olds, but with over 6,000 children self-isolating last week (14% of the borough's children), the rate is finally starting to decline. bbc.co.uk/news/uk-englan…
There are politicians in Oldham calling for self-isolation rules to be changed. Obviously there are many problems associated with self-isolation. But just ignoring the cause and compelling children to be infected seems like a bad solution. (Ventilation, vaccination, masks, etc!)

• • •

Missing some Tweet in this thread? You can try to force a refresh
 

Keep Current with Colin Davis

Colin Davis Profile picture

Stay in touch and get notified when new unrolls are available from this author!

Read all threads

This Thread may be Removed Anytime!

PDF

Twitter may remove this content at anytime! Save it as PDF for later use!

Try unrolling a thread yourself!

how to unroll video
  1. Follow @ThreadReaderApp to mention us!

  2. From a Twitter thread mention us with a keyword "unroll"
@threadreaderapp unroll

Practice here first or read more on our help page!

More from @ProfColinDavis

9 Jul
Calling all epidemiologists! Public Health England needs your help to solve a puzzling mystery.

The WHO have notified the world that the #1 Covid hotspot in Europe is the North East of England.

Why there? PHE doesn't know. They don't even know *where* it's happening in the NE.
For example, last week (Week 26, 28/6 - 4/7) there were no "situations/incidents" in hospitals, educational settings, prisons, workplaces or food outlets. Not one. And yet there were 16,607 cases in the NE that week.
The week before that (Week 25, 21-27 June) there were 9,346 cases in the NE. And how many "situations/incidents" were there in hospitals, educational settings, prisons, or food outlets? None. There was a single workplace outbreak.
Read 21 tweets
7 Jul
Here's a thread about what's happening to #Bristol's COVID rates (adults and children, and spread to different areas).

The overall rate has grown like this over the past two months. (1/7)
For context, here's what that graph looks like if we go back to August last year. It may or may not feel like it, but we're about to exceed our previous peak (of 508 per 100K). (2/7)
It was possible to predict that we'd exceed that peak some time ago, by looking at the same plot on a log scale. We can also project to where the rate will be on "Freedom Day", if we follow the same trend. It's not good. (3/7)
Read 7 tweets
6 Jul
Here's the Covid rolling rate for #Bristol (all ages). It's up to just under 400 per 100K now. This is the linear version of the plot, but it's worth looking at the log version (next) ...
The log plot shows that exponential growth is continuing at the same pace. We'll exceed our January peak in a few days (in fact, we almost certainly already have, but have to wait for the 5-day data lag to catch up). There's something else worth noting though ...
I already posted this plot, which shows that the rate hasn't been growing quite as fast in 10-14 year olds in the last couple of days. So why is the overall rate for Bristol still growing at the same pace? The answer is that ...
Read 4 tweets
6 Jul
Here's the latest graph of the COVID rolling rate for 10-14 year olds in England. It's gone up again, though not quite as steeply as a few days ago. That's another couple of thousand children testing positive (just in this age group).
Here's the log plot. The *slightly* shallower slope means the current projection is a rolling rate of ~2100 per 100K by 'Freedom Day'. That means over 100,000 10-14 year olds testing positive between now and then. Current estimates suggest ~8000 of them will experience #LongCovid
And if you're one of those people who likes to pretend that #LongCovid doesn't exist, you might instead consider that of those yet-to-be-infected 100K children, somewhere between 500 and 1000 of them will be hospitalised, and 1/4 of those will go into ICU.
Read 4 tweets
5 Jul
Here's the latest update to the graph showing the Covid rate for 10-14 year olds in England. Still doubling every 7 days.
You can see the consistency of the exponential growth in the log plot. I've taken the liberty of extending the projection to July 19th, so that we can contemplate the Path to Freedom.
BTW, if you're wondering why the first graph looks a bit different, see this thread.
Read 4 tweets
5 Jul
You might notice that the plots I post today look a little different from previous days. Here’s a thread about why that is, with a little bit on scientific communication, psychology and politics, and reflections on my own motivation.
I’ve previously posted plots in portrait format, because I figured a large proportion of views would be on phones. But some noted that Twitter lops off the top of graphs when plots are in RTs, making graphs look rather benign if the post wasn’t clicked on.
So I tried making a landscape version, and asked people which version they preferred.
Read 17 tweets

Did Thread Reader help you today?

Support us! We are indie developers!


This site is made by just two indie developers on a laptop doing marketing, support and development! Read more about the story.

Become a Premium Member ($3/month or $30/year) and get exclusive features!

Become Premium

Too expensive? Make a small donation by buying us coffee ($5) or help with server cost ($10)

Donate via Paypal Become our Patreon

Thank you for your support!

Follow Us on Twitter!

:(