Calling all epidemiologists! Public Health England needs your help to solve a puzzling mystery.
The WHO have notified the world that the #1 Covid hotspot in Europe is the North East of England.
Why there? PHE doesn't know. They don't even know *where* it's happening in the NE.
The WHO have notified the world that the #1 Covid hotspot in Europe is the North East of England.
Why there? PHE doesn't know. They don't even know *where* it's happening in the NE.

For example, last week (Week 26, 28/6 - 4/7) there were no "situations/incidents" in hospitals, educational settings, prisons, workplaces or food outlets. Not one. And yet there were 16,607 cases in the NE that week.

The week before that (Week 25, 21-27 June) there were 9,346 cases in the NE. And how many "situations/incidents" were there in hospitals, educational settings, prisons, or food outlets? None. There was a single workplace outbreak.

Now, you may have noticed that those surveillance reports did include quite a few care home "incidents". Those are important, for obvious reasons, but they don't explain where all the cases are coming from. Cases in the 70+ group made up only 1% of the NE total over this period.
That's evident in this heatmap, which shows cases by age. As you can see, cases are concentrated in the under 30s, and especially the 20-24 year age group.

There are also clues in the local area data. As I started noting a couple of weeks ago, the areas with the highest rolling rates have been places like Durham City & Jesmond - that is, areas with a high density of students.
https://twitter.com/ProfColinDavis/status/1409175566276829189?s=20
Now of course, I'm not suggesting that students catch Covid at university. We know from the PHE surveillance report that there were no "incidents" at educational settings. And universities are "Covid-secure". Or at least that's what I'm told. universitiesuk.ac.uk/news/Pages/UUK…
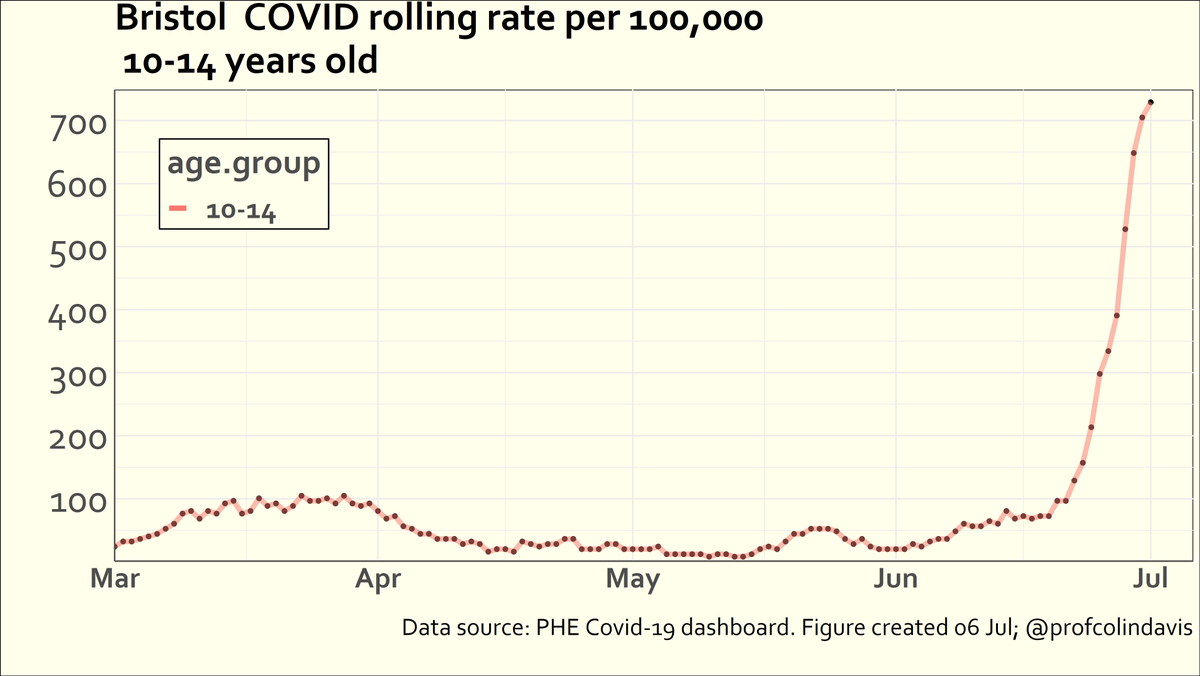
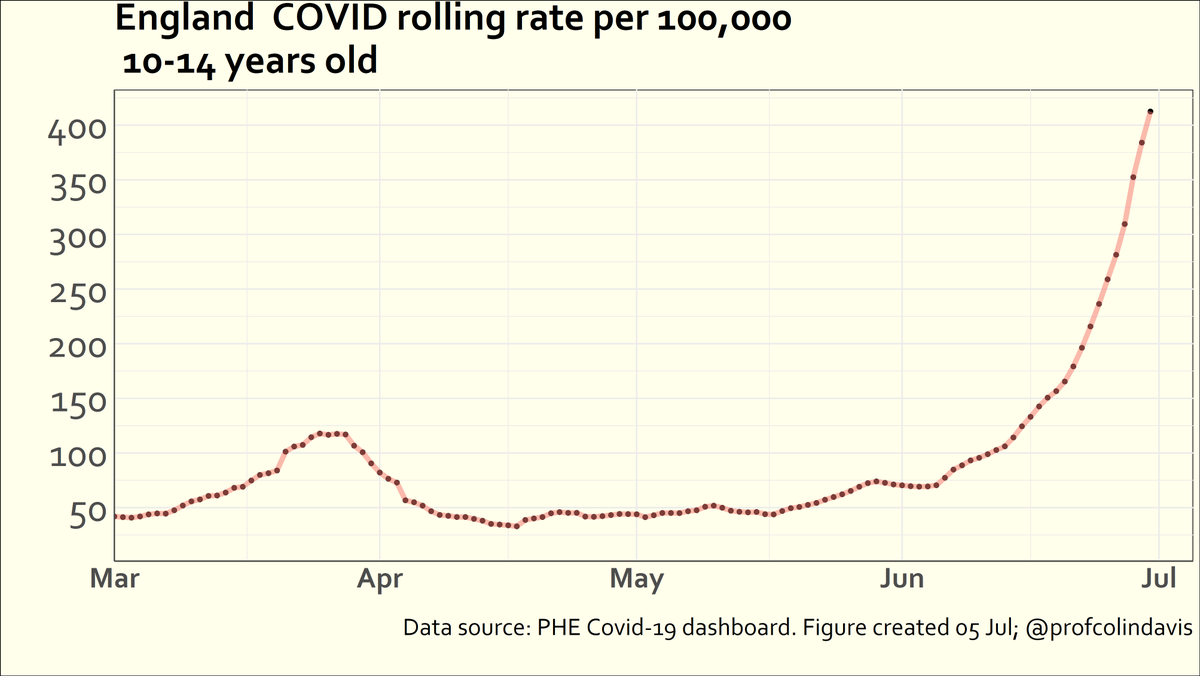
But I want to focus on another age group which has shown a massive increase in rolling rates in the last few weeks: 10-14 year olds. In Wks 24 and 25 there were 2,410 cases in that age group. Here's South Tyneside, for example, where the current rate for 10-14s is 1433 per 100K.

Presumably kids in this age group are not engaging in all-night drinking parties to celebrate the end of term. So where are they getting infected?
Maybe children are being infected by their parents? But rates are substantially higher among children than among parent aged groups, and have been throughout this period. That's a problem for the parent->child hypothesis.
It's easier to see this in the heatmap if we exclude the 15-29s. Now, this heatmap *doesn't* prove that the spread was from children to adults (and of course it can go both ways). But still, if I were PHE I'd be looking for settings where children spread COVID to each other.

But where might children spread COVID to each other? We know from PHE surveillance that there were no outbreaks in school in either of these weeks (and there was only a single "incident" in an educational setting in the preceding week, week 24).

However ... Although PHE might not have spotted them, perhaps there *were* outbreaks in schools in the North East over this period? For example, here's West Pelton, which has had to move to remote learning "due to the number of positive Covid cases in the school".

The reason I know about that one is because @DmodosCutter has been logging reports of school outbreaks throughout this whole school year. It's a Herculean (unpaid) effort, and you can see her updates here. safeedforall.com/covid-19-weekl…
Danielle's list is necessarily incomplete (there are currently 119 schools/EY settings with cases in Bristol alone), but it's a darn sight more comprehensive than the PHE surveillance. This matters for a couple of reasons:
First, attempting to control the spread of the virus ..
First, attempting to control the spread of the virus ..
.. in real time requires knowing where transmission's occurring. I'm no epidemiologist, but I know that. Hopefully when someone solves the mystery of why the NE is the Covid hotspot of Europe it won't be because the surveillance team for the North East are asleep at the wheel.
The second reason it's important we monitor where transmission is happening carefully is because the resulting *datasets* are important. No doubt there are schools that are doing a much better job of containing the virus. But I'd be rather sceptical if someone were to claim ...
... that we should be looking to the schools of the North East (where there have been *no incidents*) for guidance on how to minimise transmission. And the datasets are also important because they are being used by the DfE to formulate/justify policy.
The DfE seems set on resisting all the sensible mitigations that have been suggested over and over again. Their response is that they don't need them, as incidence in schools is low. Those thousands of infected kids in the North East? -- "Nothing to do with us, guv".
Anyway, this thread is already too long, but I had to get that off my chest. Do let @PHE_uk know if you have any suggestions as to what's been going on in the North East.
@dgurdasani1 @chrischirp @DmodosCutter @HoppySaul @karamballes @adamhamdy @Prof_GD_Foster @Dr_D_Robertson
@dgurdasani1 @chrischirp @DmodosCutter @HoppySaul @karamballes @adamhamdy @Prof_GD_Foster @Dr_D_Robertson
• • •
Missing some Tweet in this thread? You can try to
force a refresh