I've noticed that the consistency/reliability of timely COVID-19 data in the US has deteriorated over the past few weeks, due to patchy reporting by various states. This is making it harder to tell a story about what is happening. Even the CDC data gets constantly revised.
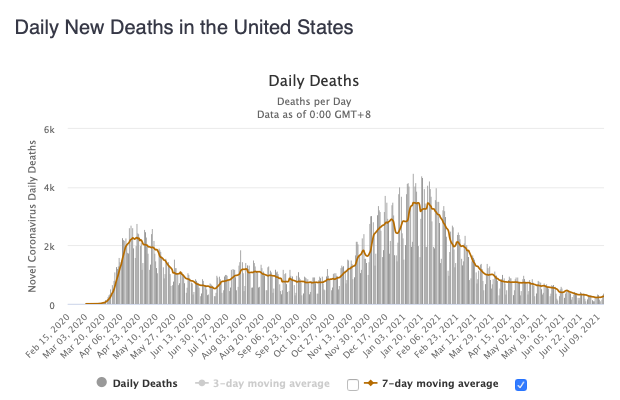
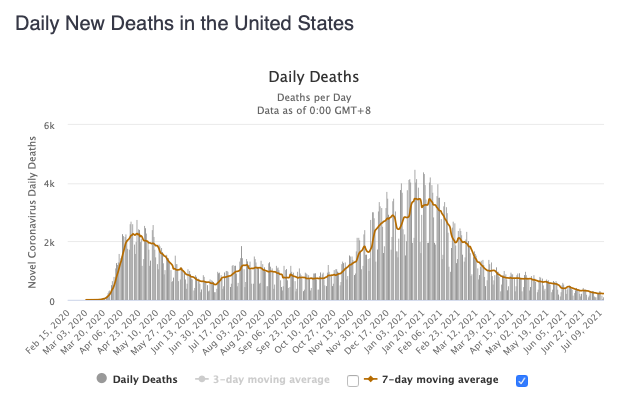
According to Worldometer, the US reported +129 coronavirus yesterday, bringing the total to 623,029. But several states, including Florida, are still missing. The 7-day moving average rose slightly to 216 deaths per day. CDC still isn't posting a number for yesterday.
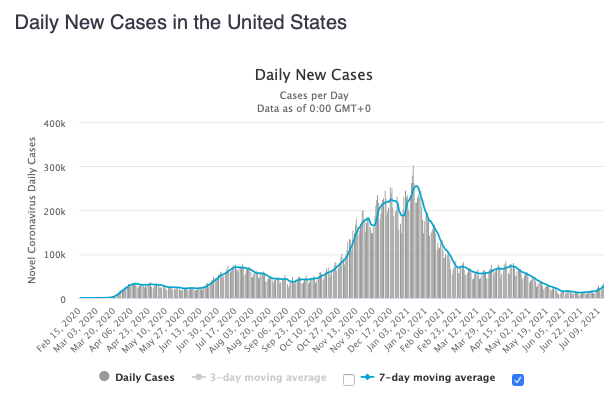
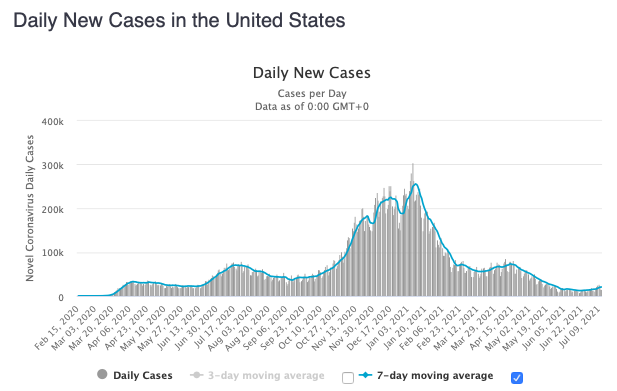
The US reported +14,715 new confirmed cases of COVID-19 yesterday. The data is more complete than deaths, but Florida, Michigan, and a few others still missing. Still, the 7-day moving average rose to above 20,000 new cases per day, for the first time since late May.
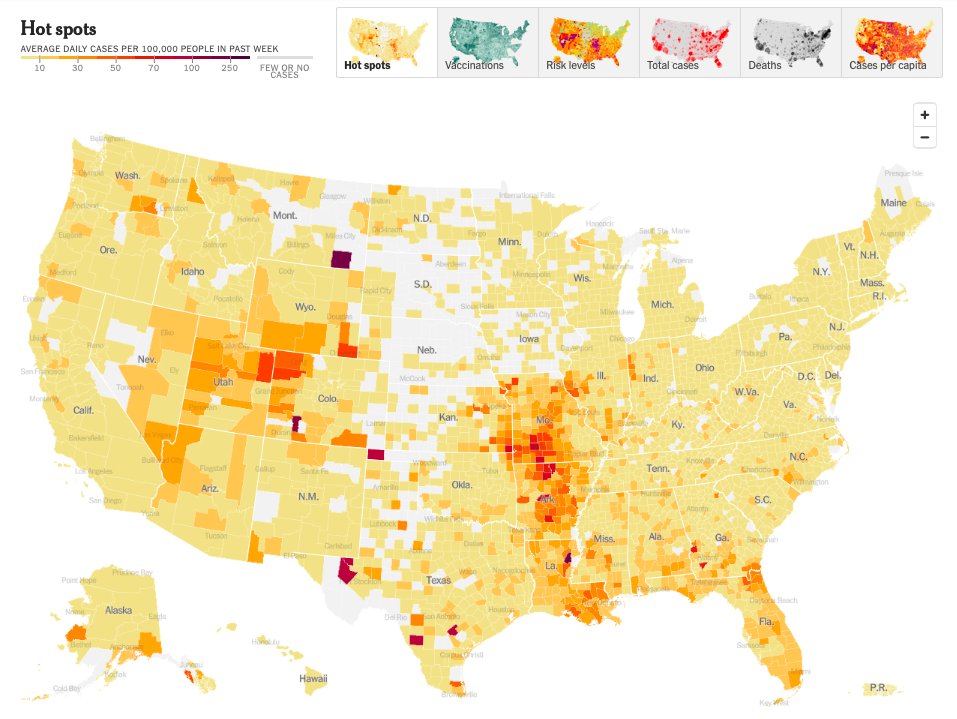
You can see here what the patchy data looks like - at a critical moment when MAYBE we are seeing a renewed inflection upwards in cases, due to the Delta variant.
What we can see is a growing hotspot in the Ozark region (Missouri, Arkansas), as well as along the Gulf Coast into Florida, and in Colorado/Utah.
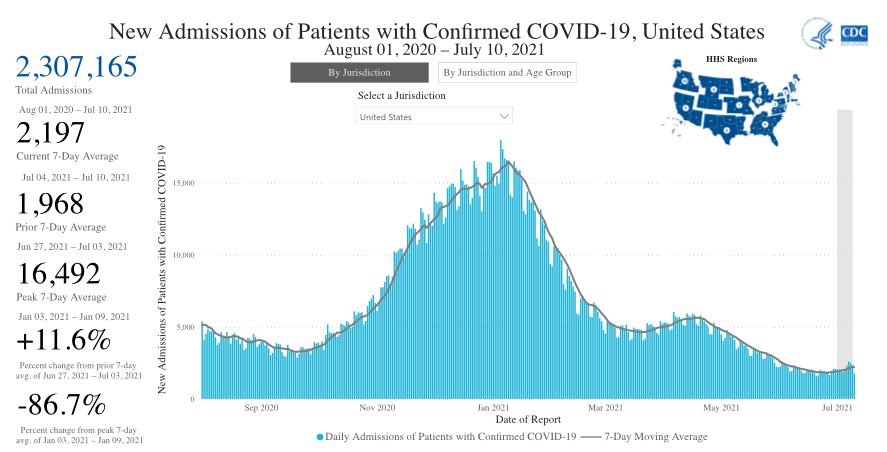
New hospital admissions in the US due to COVID-19 are up +11.6% from a week ago.
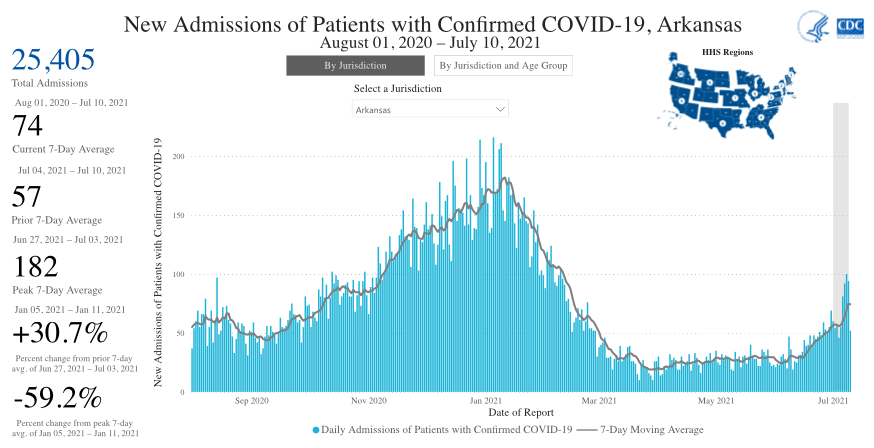
New hospital admissions in Arkansas due to COVID-19 are up +30.7% from a week ago.
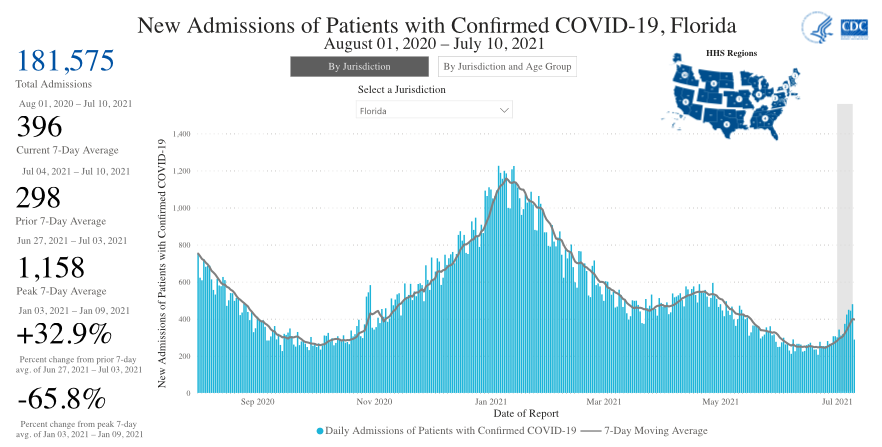
New hospital admissions in Florida due to COVID-19 are up +32.9% from a week ago.
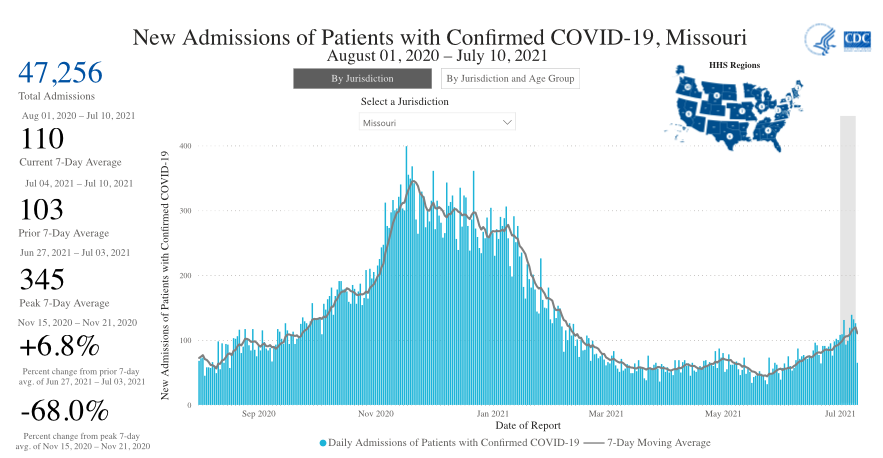
New hospital admissions in Missouri due to COVID-19 are up +6.8% from a week ago, but that was because they were already rising more steadily.
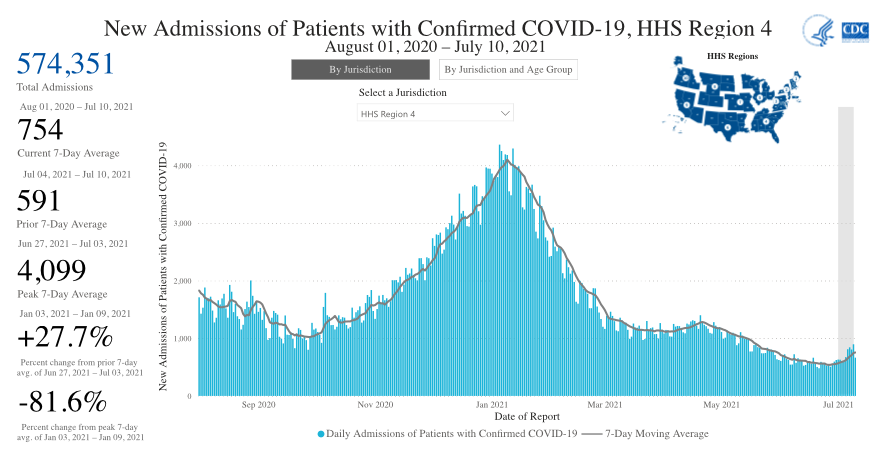
New hospital admissions in the Southeastern US as a region, due to COVID-19, are up +27.7% from a week ago.
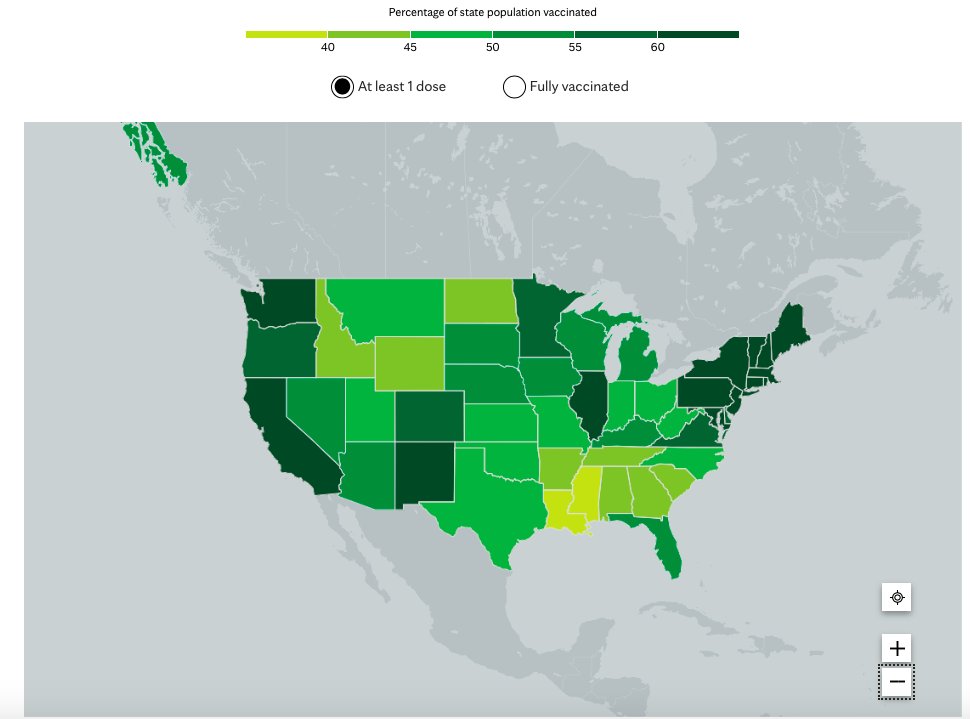
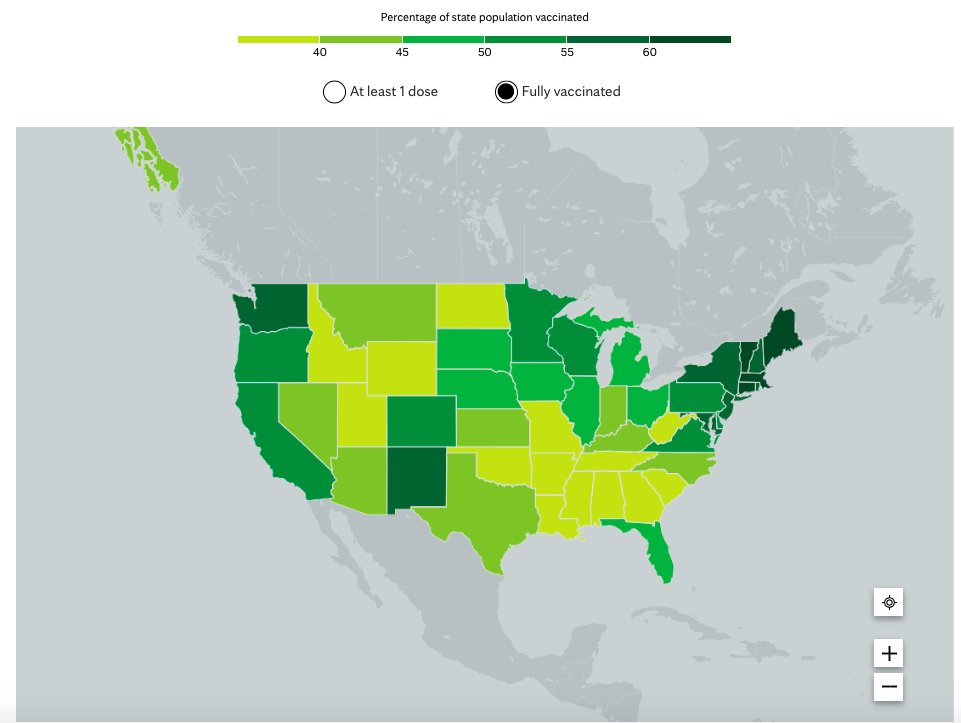
The "fully vaccinated" rate - particularly relevant to protect against the Delta variant - is even worse.
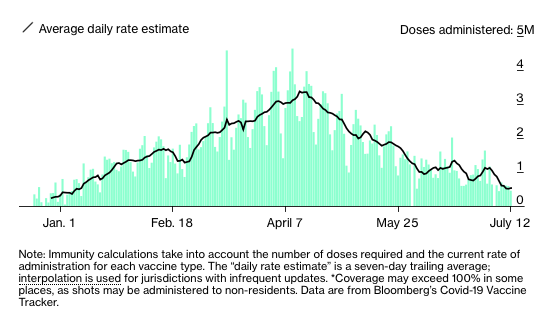
The US administered 449,000 vaccine shots yesterday, bringing the total to 335 million, or 100.8 doses per 100 people. The 7-day moving average rose slightly to 527,000 shots per day.
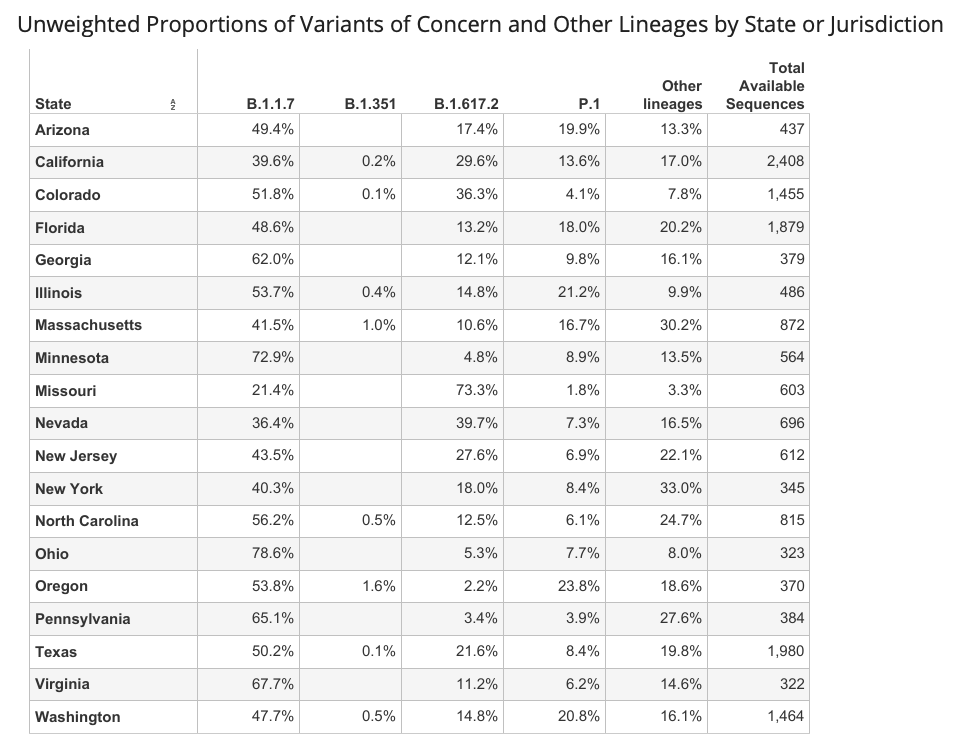
The Delta variant now accounts for 73% of new cases in Missouri, as well as 40% in Nevada and 36% in Colorado.
• • •
Missing some Tweet in this thread? You can try to
force a refresh
The US reported +374 new coronavirus deaths yesterday, bringing the total to 623,838. The 7-day moving average - important given the irregular daily reporting from some states - rose back to 259 deaths per day.
The US reported +35,447 new confirmed cases of COVID-19 yesterday, bringing the total to over 34.8 million. The 7-day moving average rose to 26,704 new cases per day, its highest since May 22.
The long US decline in new COVID cases and deaths appears to be over, and are now beginning to rebound - mostly among the unvaccinated.
US producer prices (PPI - final demand) rose +1.0% m/m in June, up +7.1% from a year ago. PPI is often seen as a leading indicator of consumer inflation, though it is typically more volatile (bigger swings both up and down).
The chart of y/y PPI for finished goods, which goes back to 1947, gives a better historical perspective of where PPI currently stands.
Core PPI (excluding food and energy) rose +1.0% m/m in June, up +5.6% from a year ago.
Today in Microsoft Flight Sim, I'm off to the interior of Brazil to fly the Embraer EMB200 Ipanema, and explore the surprisingly fascinating world of crop dusters.
If this airplane looks familiar, that's because it was the model for Dusty Crophopper in the movie Planes.
Well, technically Dusty is an Air Tractor AT-502, manufactured in Texas not Brazil, but the EMB200 is a virtually identical airplane.
Regarding inflation, it's good to define transitory vs. persistent. Transitory would be the next several months, to the end of the year. Persistent would be the next decade.
When trying to understand the economy, we tend to refer back to historical experiences as our model. In the case of inflation, for most of us, the go-to reference is the experience of the 1970s.
But there are other historical models that may capture the situation better. I'd argue it's possible that our current experience of inflation bears less resemblance to the inflation of the 1970s than the surge in inflation immediately after World War II.
I'm not sure the size of the y/y figure tells you whether it's transitory or not. A high number could easily be as reflective of a temporary spike, due to bottlenecks, as it would a more lasting problem.
A lot of the price pressure being reported by companies in the ISM surveys do seem to reflect bottlenecks, as opposed to more persistent constraints. Of course, it's possible that one can turn into the other, if unresolved.
The fundamental problem here is that the entire supply side of the economy - from labor markets to foreign supply chains - has been thrown into utter chaos over the past year, even as stimulus spending has helped demand recover quite buoyantly.