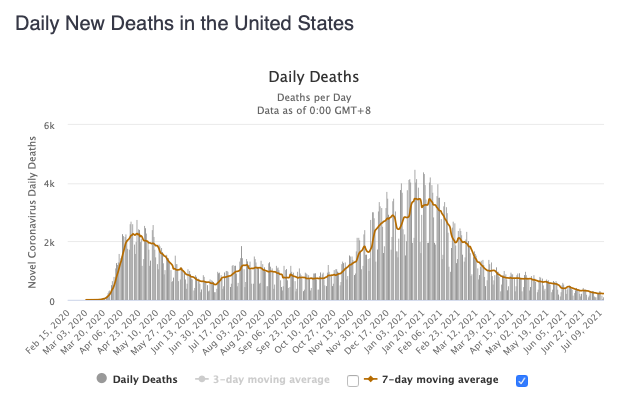
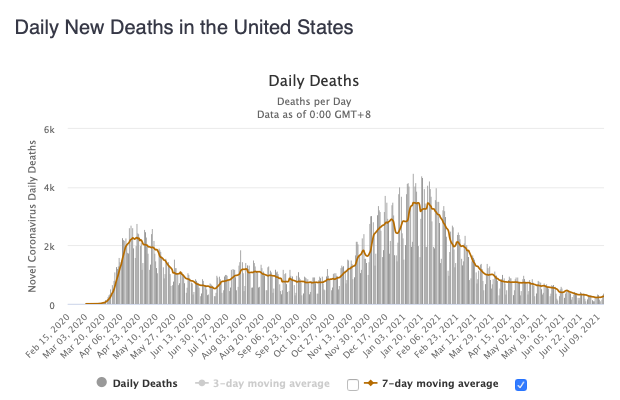
The US reported +374 new coronavirus deaths yesterday, bringing the total to 623,838. The 7-day moving average - important given the irregular daily reporting from some states - rose back to 259 deaths per day.
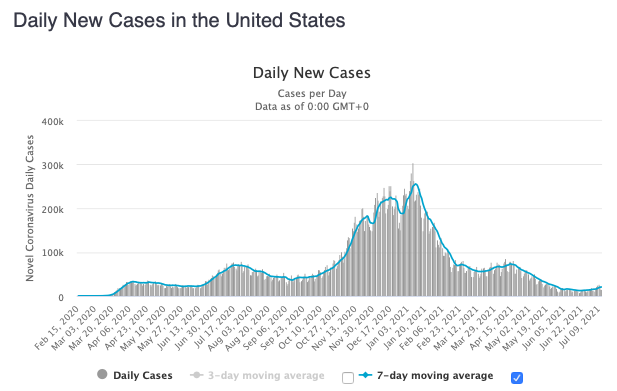
The US reported +35,447 new confirmed cases of COVID-19 yesterday, bringing the total to over 34.8 million. The 7-day moving average rose to 26,704 new cases per day, its highest since May 22.
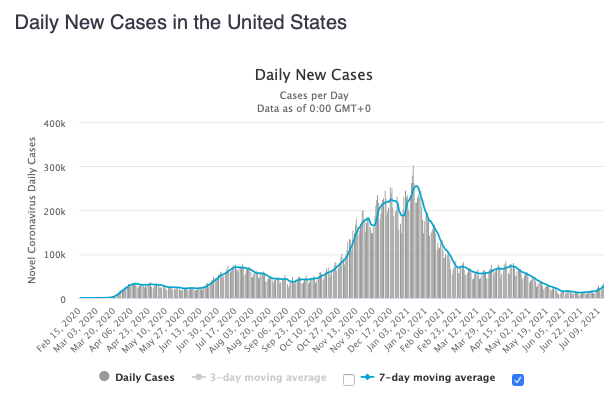
The long US decline in new COVID cases and deaths appears to be over, and are now beginning to rebound - mostly among the unvaccinated.
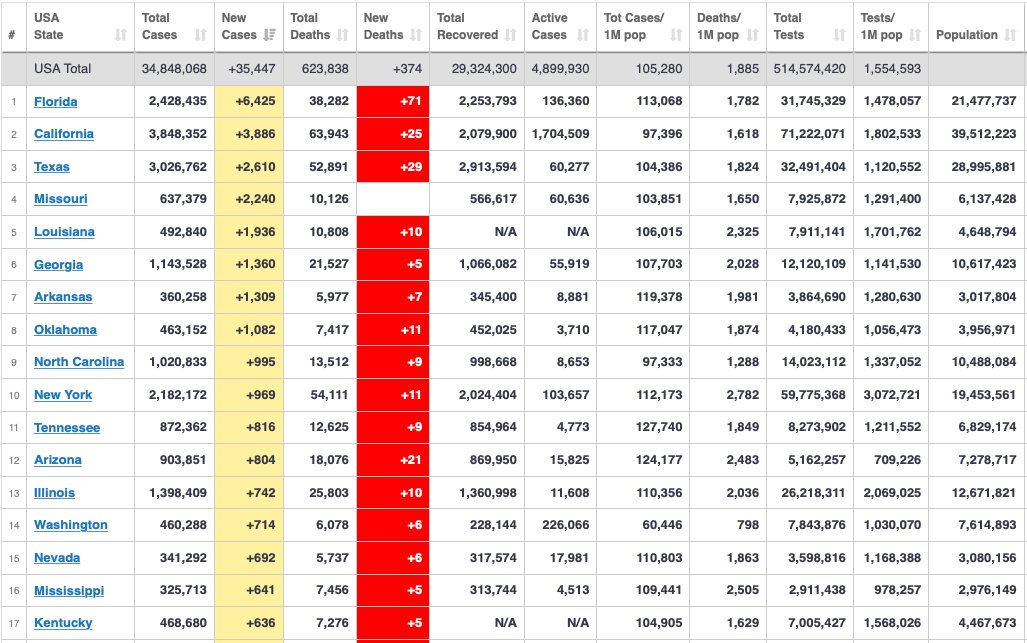
Eight US states had over 1,000 new cases yesterday. Florida led the pack with over 6,000, though this likely included unreported cases from earlier in the week. California had over 3,000, and Texas and Missouri both had over 2,000.
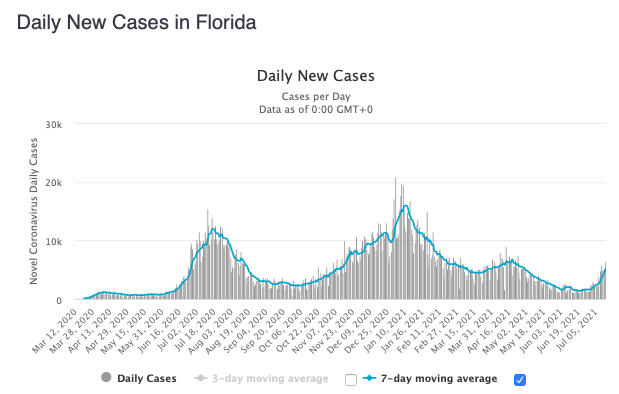
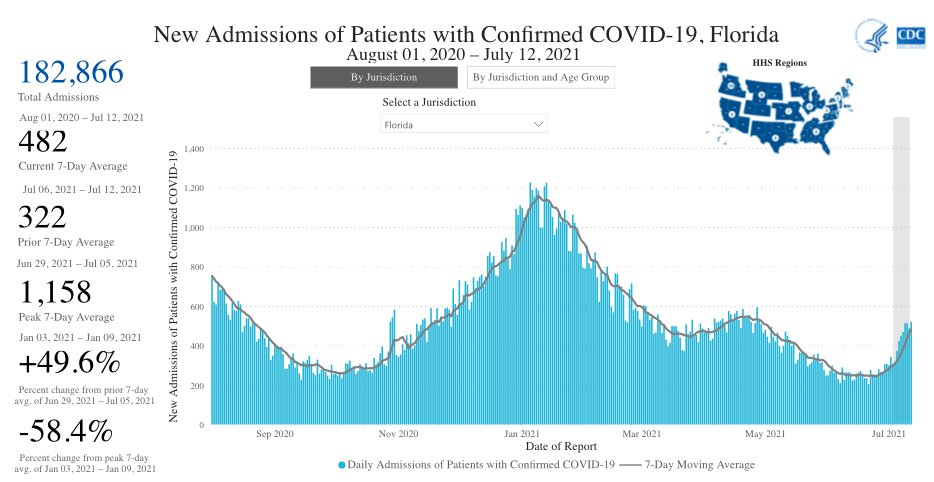
New cases in Florida are clearly spiking upwards, to over 5,000 per day, their highest since late April.
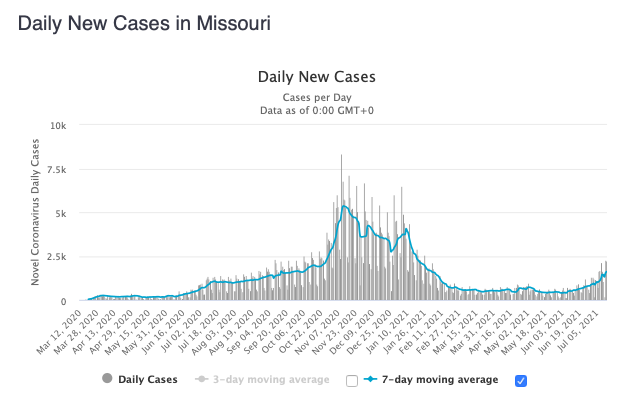
New cases in Missouri - mostly driven by the Delta variant - are back to their highest levels since January.
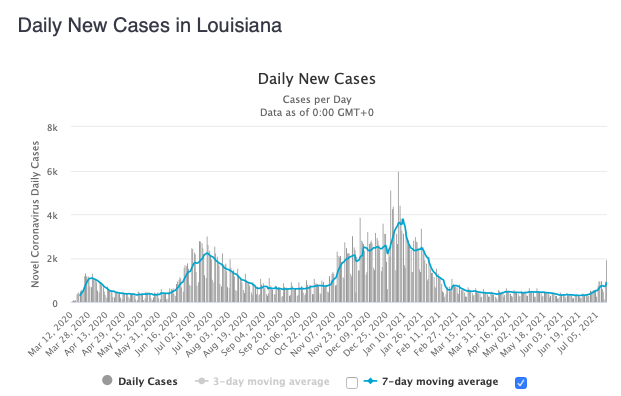
New cases in Louisiana hit their highest yesterday since February.
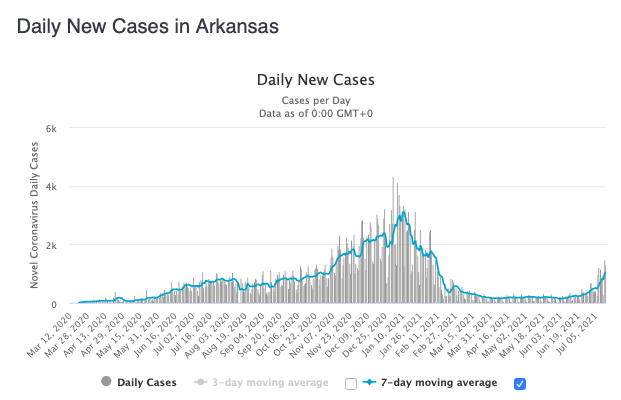
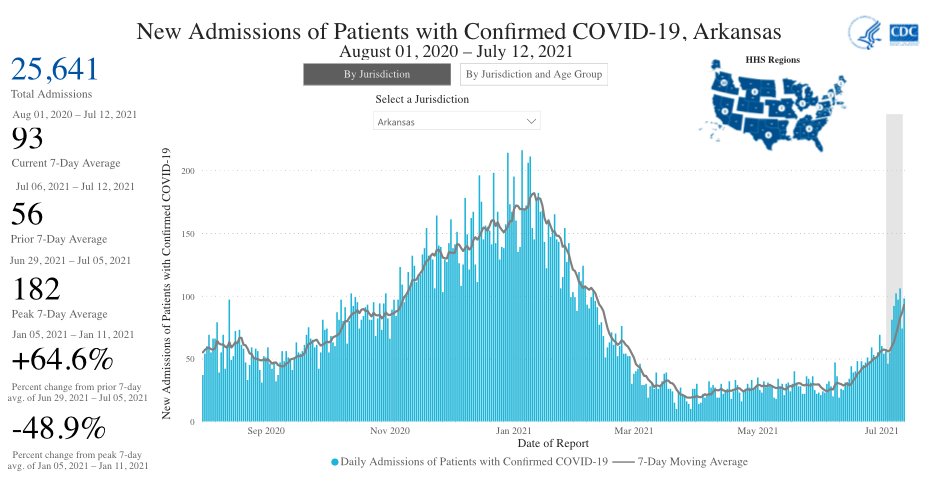
New cases in Arkansas have also hit their highest level since February.
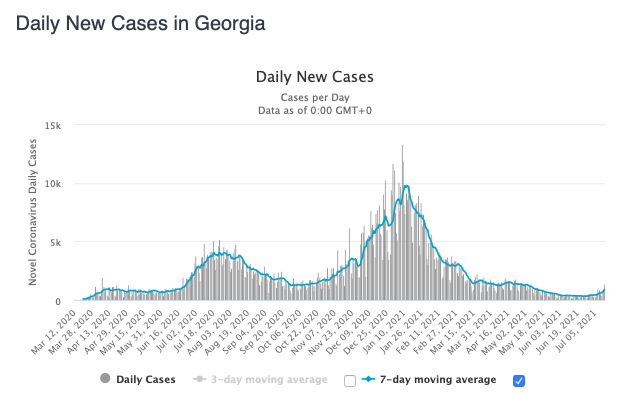
New cases in Georgia are starting to inch upwards.
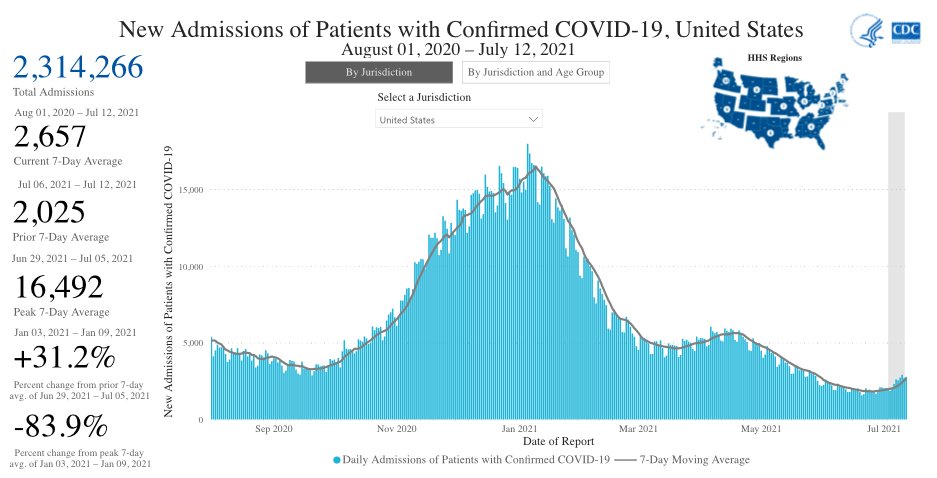
New hospital admissions in the US due to COVID-19 are up +31.2% from a week ago.
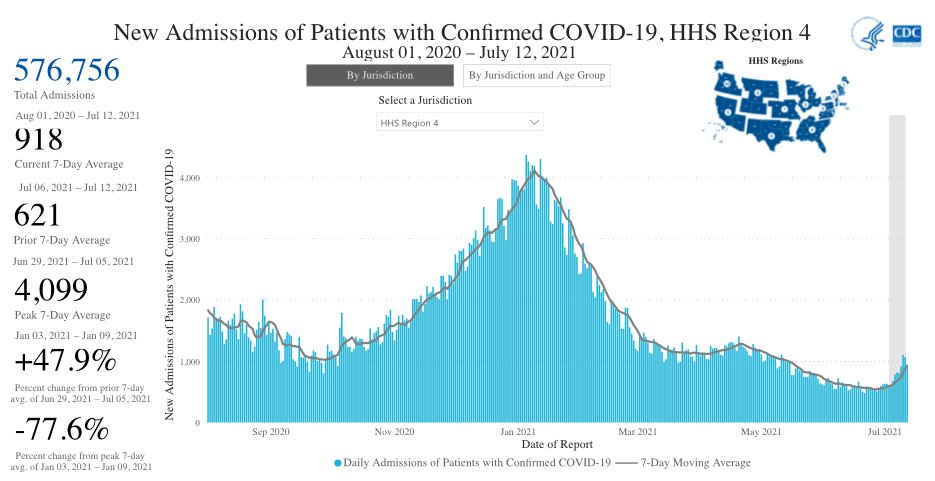
New hospital admissions in the southeastern US states, where vaccination rates are lowest, are up +47.9% from a week ago.
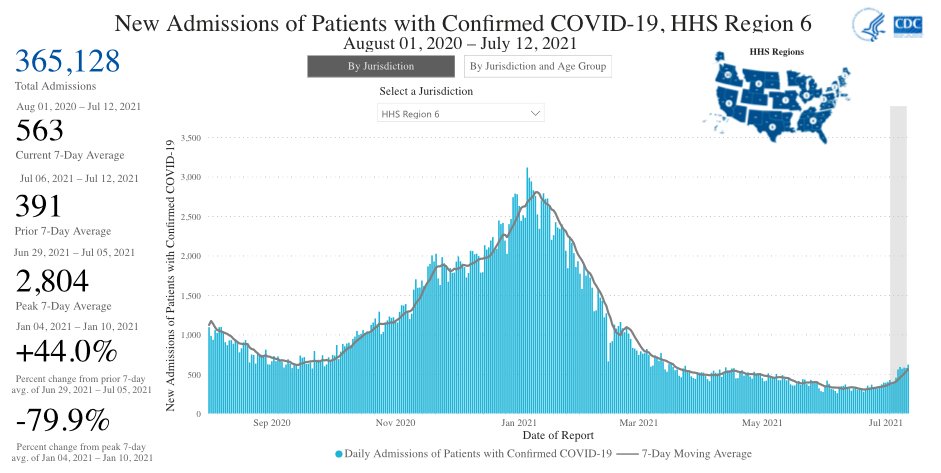
New hospitalization admissions in the south-central US, including Louisiana, Arkansas, and Texas, are up +44.0% from a week ago.
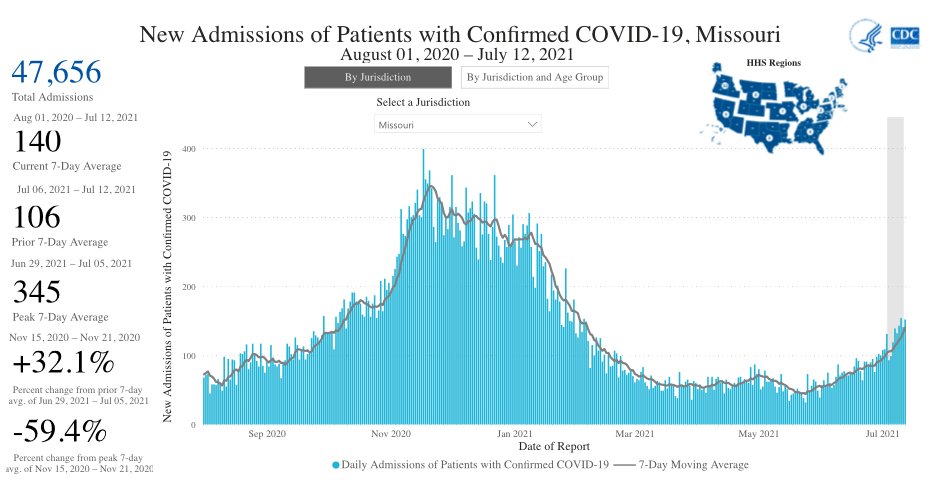
New hospital admissions in Missouri due to COVID-19 are up +32.1% from a week ago.
New hospital admissions in Arkansas due to COVID-19 are up +64.6% from a week ago, back to their levels in February.
New hospital admissions in Florida due to COVID-19 are up +49.6% from a week ago.
New hospital admissions in Louisiana due to COVID-19 are up +49.3% from a week ago.
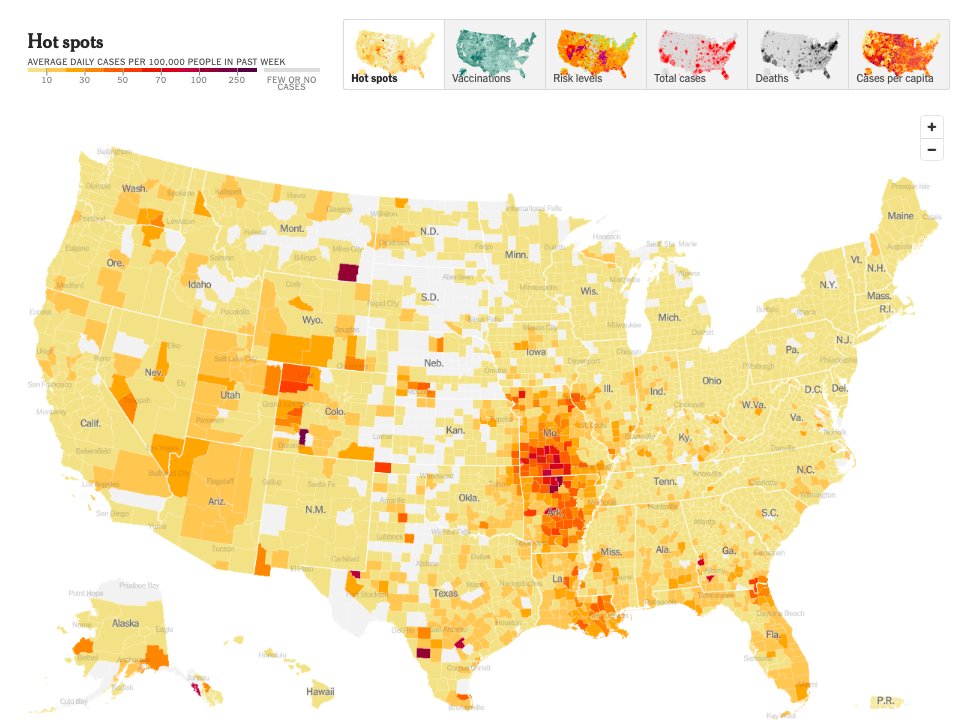
This latest map from nytimes.com shows the areas of the US that are seeing a renewed rise in COVID-19 infections, over the past week. nytimes.com/interactive/20…
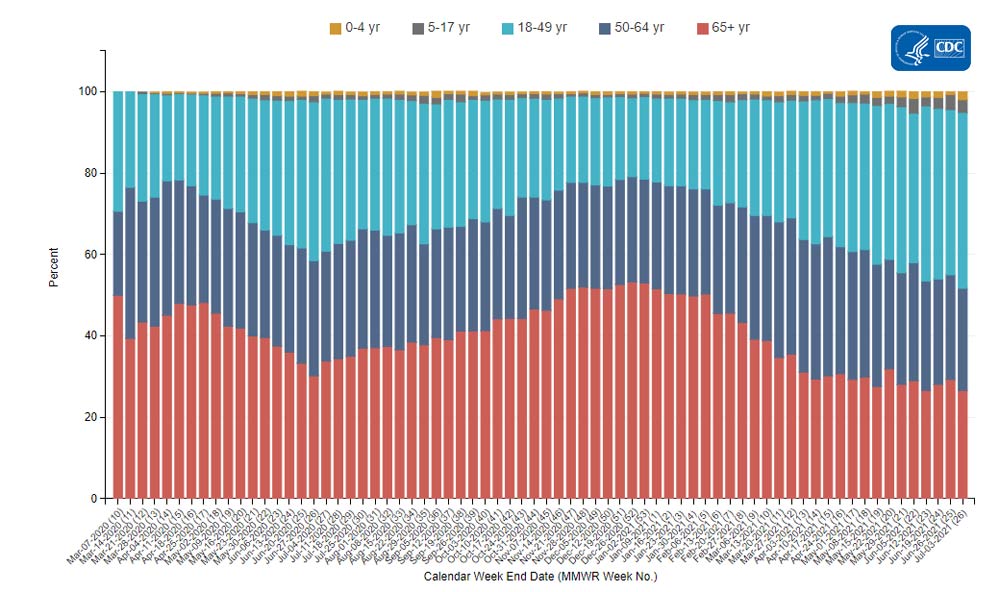
Hospitalizations from COVID are trending younger in the US, according to the latest CDC data.
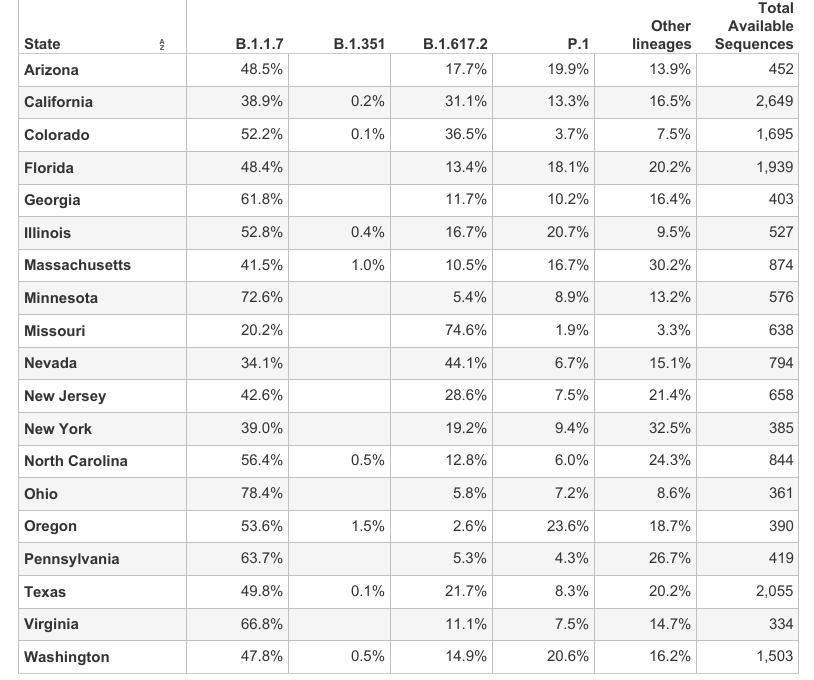
As of the latest data (early July), the Delta strain (originating in India) has become dominant in the US, accounting for over half of all new infections.
The main focus of the Delta variant remains the Ozark hotspot. But Nevada is also an emerging hotspot.
New hospitalizations in Nevada due to COVID-19 are up +25.9% from a week ago, though they were already rising noticeably then.
The US only administered 546,000 new vaccine shots yesterday, bringing the total to 335 million, or 101.1 doses per 100 people. The 7-day moving average rose slightly to 548,000 shots per day.
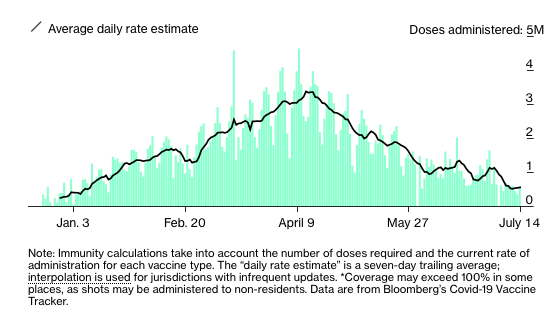
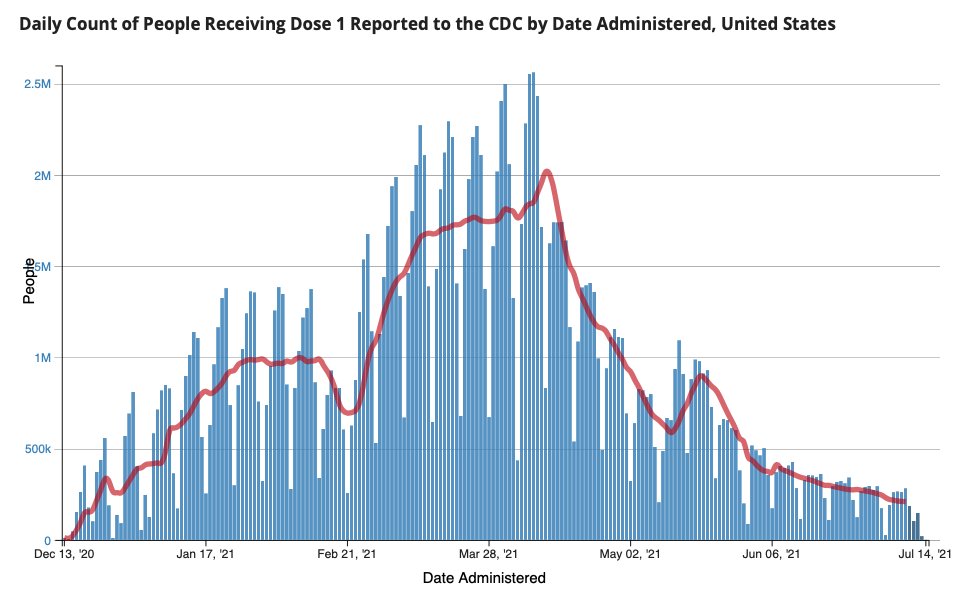
The number of Americans receiving their first vaccine shot has slowed to a crawl.
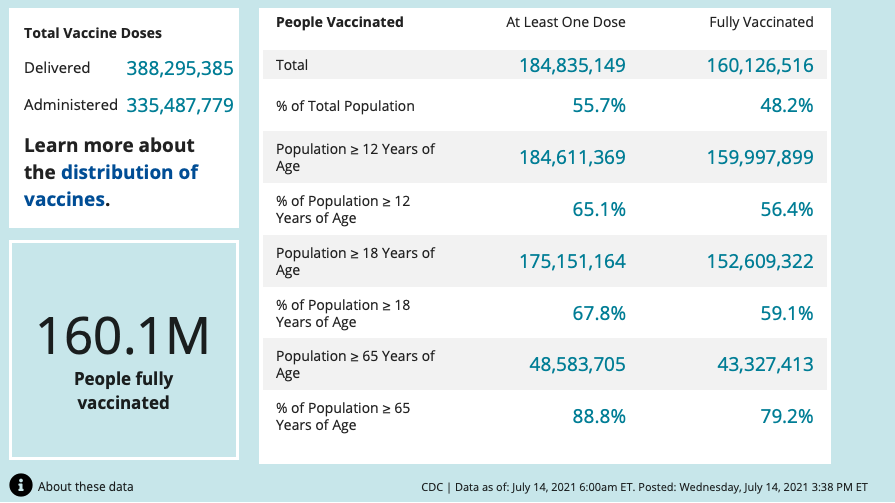
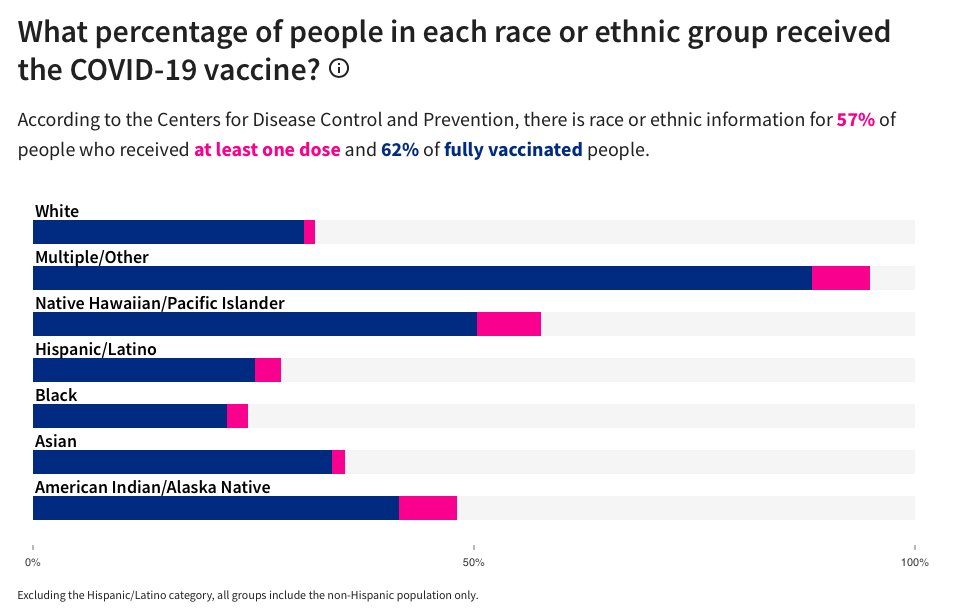
65.1% of qualified Americans (age 12 and over) have received at least one vaccine shot; 56.1% are now fully vaccinated.

Over 83 million American adults and nearly 16 million qualified children remain completely unvaccinated.
I'd be interesting in an interpretation of this chart. Who are the "multiple/other" and why are their vaccination rates so high compared to everyone else? usafacts.org/visualizations…
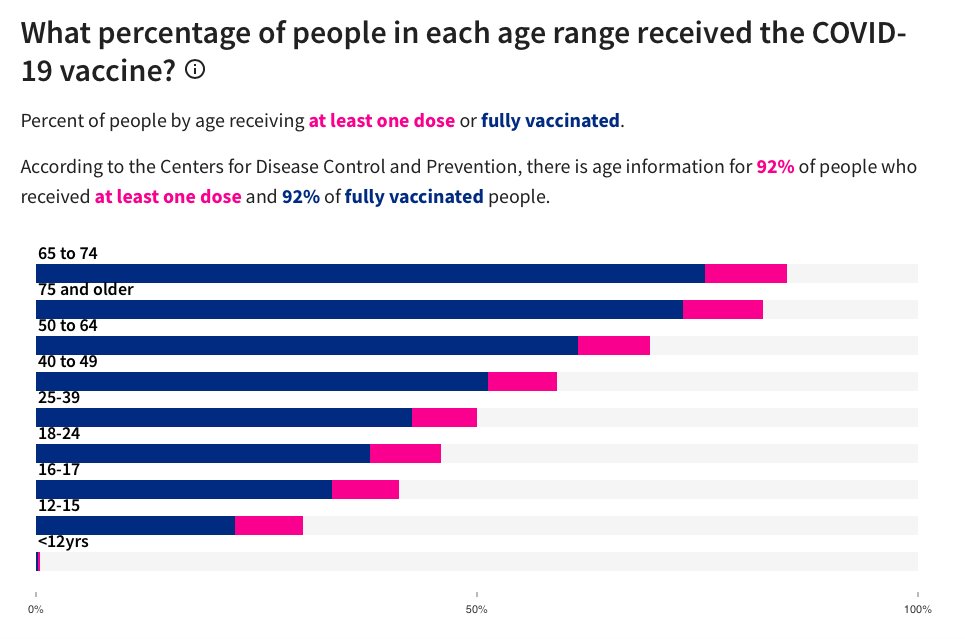
Vaccination rates vary predictably by age. Together with the fact that nearly all hospitalizations are now unvaccinated patients, this almost certainly explains why hospitalizations are trending younger.

• • •

Missing some Tweet in this thread? You can try to force a refresh
 

Keep Current with Patrick Chovanec

Patrick Chovanec Profile picture

Stay in touch and get notified when new unrolls are available from this author!

Read all threads

This Thread may be Removed Anytime!

PDF

Twitter may remove this content at anytime! Save it as PDF for later use!

Try unrolling a thread yourself!

how to unroll video
  1. Follow @ThreadReaderApp to mention us!

  2. From a Twitter thread mention us with a keyword "unroll"
@threadreaderapp unroll

Practice here first or read more on our help page!

More from @prchovanec

15 Jul
US producer prices (PPI - final demand) rose +1.0% m/m in June, up +7.1% from a year ago. PPI is often seen as a leading indicator of consumer inflation, though it is typically more volatile (bigger swings both up and down).
The chart of y/y PPI for finished goods, which goes back to 1947, gives a better historical perspective of where PPI currently stands.
Core PPI (excluding food and energy) rose +1.0% m/m in June, up +5.6% from a year ago.
Read 9 tweets
13 Jul
Today in Microsoft Flight Sim, I'm off to the interior of Brazil to fly the Embraer EMB200 Ipanema, and explore the surprisingly fascinating world of crop dusters.
If this airplane looks familiar, that's because it was the model for Dusty Crophopper in the movie Planes.
Well, technically Dusty is an Air Tractor AT-502, manufactured in Texas not Brazil, but the EMB200 is a virtually identical airplane.
Read 42 tweets
13 Jul
Regarding inflation, it's good to define transitory vs. persistent. Transitory would be the next several months, to the end of the year. Persistent would be the next decade.
When trying to understand the economy, we tend to refer back to historical experiences as our model. In the case of inflation, for most of us, the go-to reference is the experience of the 1970s.
But there are other historical models that may capture the situation better. I'd argue it's possible that our current experience of inflation bears less resemblance to the inflation of the 1970s than the surge in inflation immediately after World War II.
Read 10 tweets
13 Jul
I'm not sure the size of the y/y figure tells you whether it's transitory or not. A high number could easily be as reflective of a temporary spike, due to bottlenecks, as it would a more lasting problem.
A lot of the price pressure being reported by companies in the ISM surveys do seem to reflect bottlenecks, as opposed to more persistent constraints. Of course, it's possible that one can turn into the other, if unresolved.
The fundamental problem here is that the entire supply side of the economy - from labor markets to foreign supply chains - has been thrown into utter chaos over the past year, even as stimulus spending has helped demand recover quite buoyantly.
Read 4 tweets
13 Jul
US consumer prices (CPI) rose +0.9% m/m in June, up +5.3% from a year ago, its highest y/y rate since January 1991.
Core CPI (excluding food and energy) also rose +0.9% m/m in June, up +4.5% from a year ago, its highest y/y rate since September 1991.
Often volatile US consumer energy prices rose +1.5% m/m in June, up +24.2% from a year ago.
Read 5 tweets
13 Jul
I've noticed that the consistency/reliability of timely COVID-19 data in the US has deteriorated over the past few weeks, due to patchy reporting by various states. This is making it harder to tell a story about what is happening. Even the CDC data gets constantly revised.
According to Worldometer, the US reported +129 coronavirus yesterday, bringing the total to 623,029. But several states, including Florida, are still missing. The 7-day moving average rose slightly to 216 deaths per day. CDC still isn't posting a number for yesterday.
The US reported +14,715 new confirmed cases of COVID-19 yesterday. The data is more complete than deaths, but Florida, Michigan, and a few others still missing. Still, the 7-day moving average rose to above 20,000 new cases per day, for the first time since late May.
Read 14 tweets

Did Thread Reader help you today?

Support us! We are indie developers!


This site is made by just two indie developers on a laptop doing marketing, support and development! Read more about the story.

Become a Premium Member ($3/month or $30/year) and get exclusive features!

Become Premium

Too expensive? Make a small donation by buying us coffee ($5) or help with server cost ($10)

Donate via Paypal Become our Patreon

Thank you for your support!

Follow Us on Twitter!

:(