Fascinating piece by @ezraklein in the @nytimes. Among the wide-ranging discussion is a mention of a silver lining: the world is on track for around 3C warming compared to the 4 to 5C that seemed likely a decade ago. Unfortunately, some caveats are needed: nytimes.com/2021/07/15/opi…
When we try to project future warming, we are really dealing with three separate sets of uncertainties. The first, which we can control, is our emissions. There we have had some good news; global coal use peaked back in 2013, and is now in structural decline according to the @IEA
This means that truly nightmarish scenarios – where global emissions double or triple by 2100 – seem a lot less likely today when clean energy sources are cheaper than fossil fuels at the margin in many places as @Peters_Glen and I discussed in @nature: nature.com/articles/d4158…
However, there are still two other uncertainties – climate sensitivity and carbon cycle feedbacks – that add a lot of uncertainty in the amount of warming we will experience under a given emissions trajectory:
It is quite possible that we could get unlucky and end up with 4C or more warming under a current policy world if we roll 6s on the climate sensitivity and carbon cycle feedback dice.
It is these low probability high impact outcomes that tend to dominate a lot of climate damage estimates; as the late Marty Weitzman was fond of saying, when it comes to climate change the sting is in the tail.
There is also the important fact that the world does not end in 2100, even though most of our models do. As a father of a 3-year-old who will hopefully be alive well into the 22nd century, I've become acutely aware of the limitations of this arbitrary timeframe that we focus on.
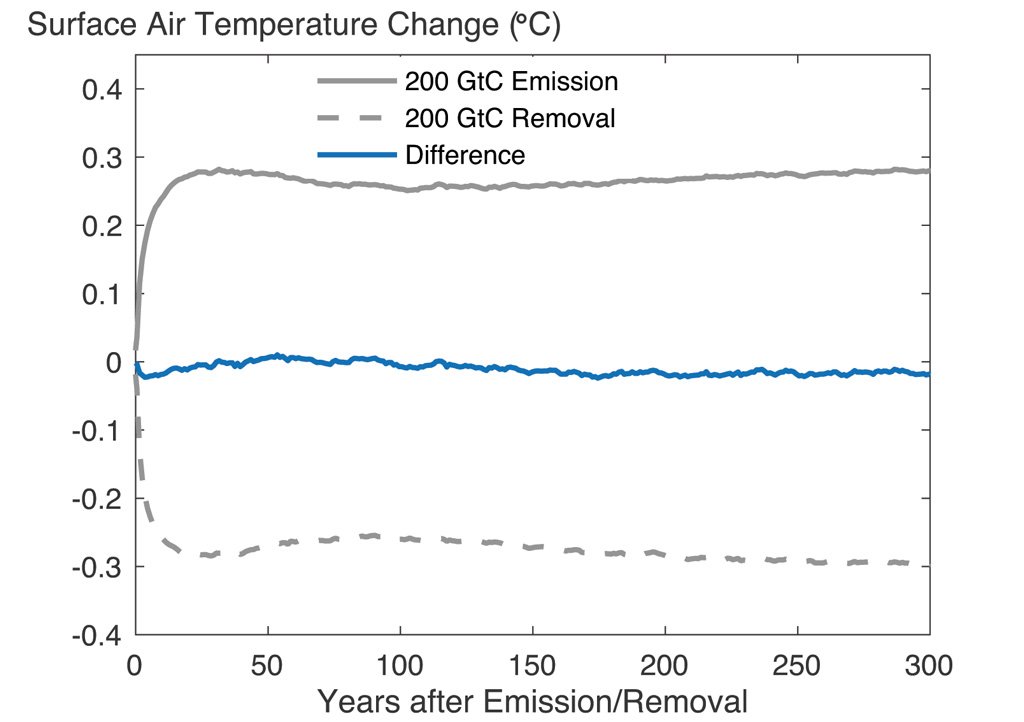
CO2 accumulates in the atmosphere over time, and until emissions reach net-zero the world will continue to warm. This is the brutal math of climate change, and it means that the world will continue to warm well beyond the year 2100 if our emissions remain positive.
So while we can happy progress has been made, we have a long way to go: both to avoid quite bad climate impacts at 3C warming, and to lower the risk of truly catastrophic outcomes. We should avoid being overly deterministic in the outcomes that our current policies may produce.
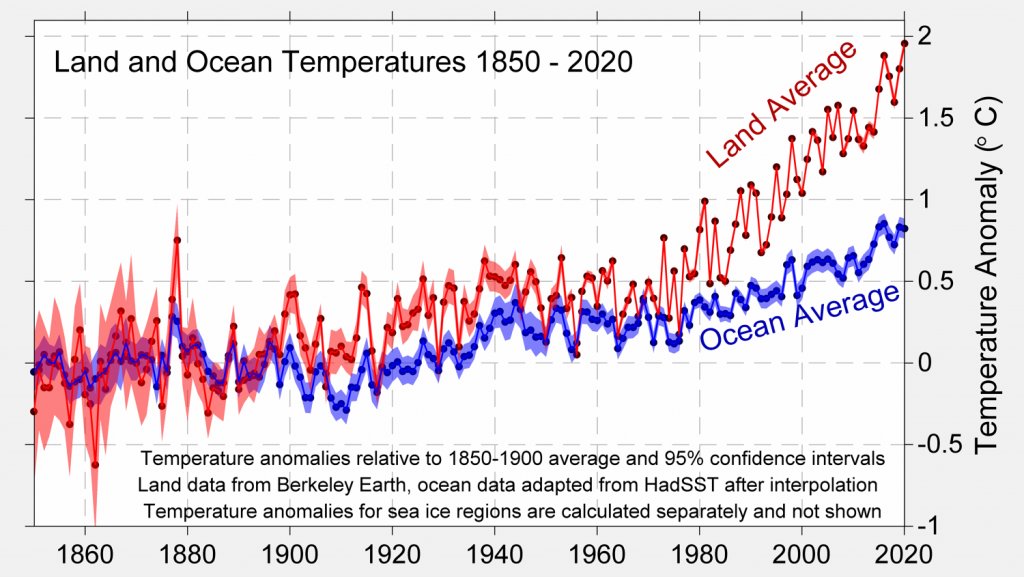
One final caveat: no one lives in the global average. Most of our planet is water, and these global average temperature numbers serve to obscure much larger (+50%) warming over land areas where we all live.

• • •

Missing some Tweet in this thread? You can try to force a refresh
 

Keep Current with Zeke Hausfather

Zeke Hausfather Profile picture

Stay in touch and get notified when new unrolls are available from this author!

Read all threads

This Thread may be Removed Anytime!

PDF

Twitter may remove this content at anytime! Save it as PDF for later use!

Try unrolling a thread yourself!

how to unroll video
  1. Follow @ThreadReaderApp to mention us!

  2. From a Twitter thread mention us with a keyword "unroll"
@threadreaderapp unroll

Practice here first or read more on our help page!

More from @hausfath

14 Jul
Solar has had remarkable success making clean energy cheap. But in California its increasingly a victim of its own success. In a major new report we find solar value in CA fell 37% since 2014, and explore race between value deflation and cost declines: thebreakthrough.org/articles/quant…
1/
California leads the world in solar installation. In 2019 it generated 19.2% of all of its electricity from solar, with 13% from utility scale solar and the remainder from distributed rooftop solar: 2/
Solar is intermittent, but predictably so. It always generates electricity when the sun is shining, and in sunny California does not experience that much day-to-day variability. Heres what California Independent System Operator (CAISO) gen looks like in a typical spring week: 3/
Read 20 tweets
8 Jul
In the 2000s global CO2 emissions grew at 3% per year. Over the past decade, however, this slowed to only 1% per year.

In a new analysis we find that falling energy intensity of GDP and emissions intensity of energy were main drivers of this decline: thebreakthrough.org/issues/energy/…
1/
A useful (though imperfect) tool to decompose drivers of emissions is the Kaya identity; it represents emissions as a combination of population, economic growth per person, energy intensity of the economy, and carbon intensity of energy: en.wikipedia.org/wiki/Kaya_iden… 2/
We can use this identity to decompose the drivers of emissions growth during each year. It turns out, conveniently, the the growth rate of emissions is the sum of the growth rates of each of the underlying factors. Here are drivers of global emissions since 2000: 3/
Read 21 tweets
1 Jul
Its a tad disconcerting that the CMIP6 multimodel mean (using the 41 unique models current available) for the scenario intended well-below 2C – SSP1-2.6 – gives more than 2C warming by 2100:
That said, there are reasons to somewhat discount some of the very high sensitivity models that drive the overall multimodel mean upwards since CMIP5: thebreakthrough.org/issues/energy/…
Lots of other recent papers making this point:
Read 4 tweets
23 Jun
Today the media is reporting on leaked Second Order Drafts of the IPCC WG2 report, due out in early 2022. I won't comment on the substance of the draft, apart to note that substantial revisions are often made between second order and final versions of the report.
There is a real risk or misrepresentation or inaccurate reporting based on leaked drafts, given that others cannot reference the original source. For example, @AFP is inaccurately reporting that climate change caused "crop production to fall 4%-10% in the last 30 years".
Global crop yields increased substantially over the last 30 years. At the same time, climate changes likely resulted in lower yield growth than in a world without climate change. But thats a much more nuanced claim than readers would assume the IPCC is making based on reporting. Image
Read 4 tweets
21 Jun
Great new paper by @KirstenZickfeld on the asymmetry of the effects on atmospheric concentration and temperatures between carbon additions and removals. She has an accessible explainer of the findings over at @CarbonBrief: carbonbrief.org/guest-post-why…
In short, they find that removing CO2 from the atmosphere is 3% to 18% less effective at reducing concentrations than adding it was in the first place, becoming less effective as more is removed. Thankfully the asymmetry for temperature are smaller – only 2% to 7% less:
None of this should suggest that carbon removals are not effective or needed; even if they were 20% less effective (at the extreme) than emissions additions, they would still be key to offset a long tail of hard to decarbonize activities.
Read 4 tweets
15 Jun
The last 12 months have been the driest period in the Western US since records began in 1895.

In a typical year the the western US gets around 17 inches of rain on average. Over the last 12 months we have only gotten 8.7 inches.
During the same period, the region has warmed nearly 2C, with nearly all of that warming occurring in the years since 1970. Warmer temperatures dry out soils and vegetation, and helps drive the catastrophic wildfires we have experienced in the past few years.
While there is a clear link between climate change and heavier (if at times less frequent) rainfall, the links between average precipitation and climate are more complex. For details, see my @CarbonBrief explainer: carbonbrief.org/explainer-what…
Read 4 tweets

Did Thread Reader help you today?

Support us! We are indie developers!


This site is made by just two indie developers on a laptop doing marketing, support and development! Read more about the story.

Become a Premium Member ($3/month or $30/year) and get exclusive features!

Become Premium

Too expensive? Make a small donation by buying us coffee ($5) or help with server cost ($10)

Donate via Paypal Become our Patreon

Thank you for your support!

Follow Us on Twitter!

:(