Capex chronicles - a thread on India Inc Capex across last 2 decades and 4 key trends

1. Trend#1- headline capex flatlining....Listed India Inc capex (incl M&A) has flatlined across most of last decade, with capex to sales falling to 6-7% from 11%.
US S&P500 (ex fin) capex to sales has also been in a narrow band of 6-7% (post dotcom bust), however proportion of spends on R& D hv gone up materially. For eg, Apple Inc has taken R&D to sales from 2%(2011) to 8% (2020)
Trend#2: polarization 1.0

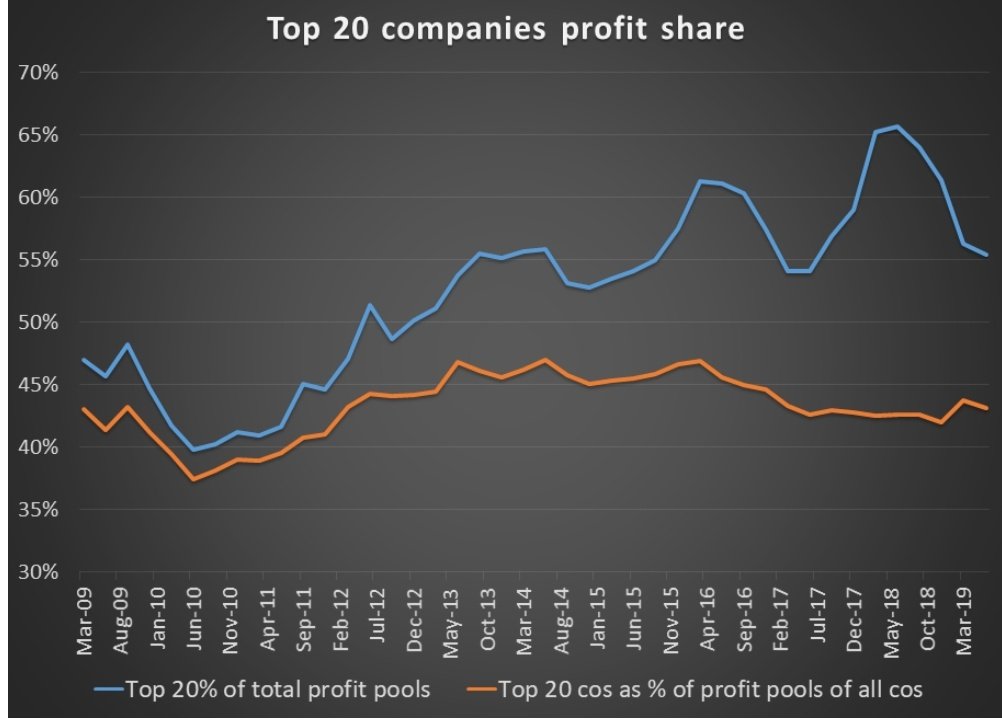
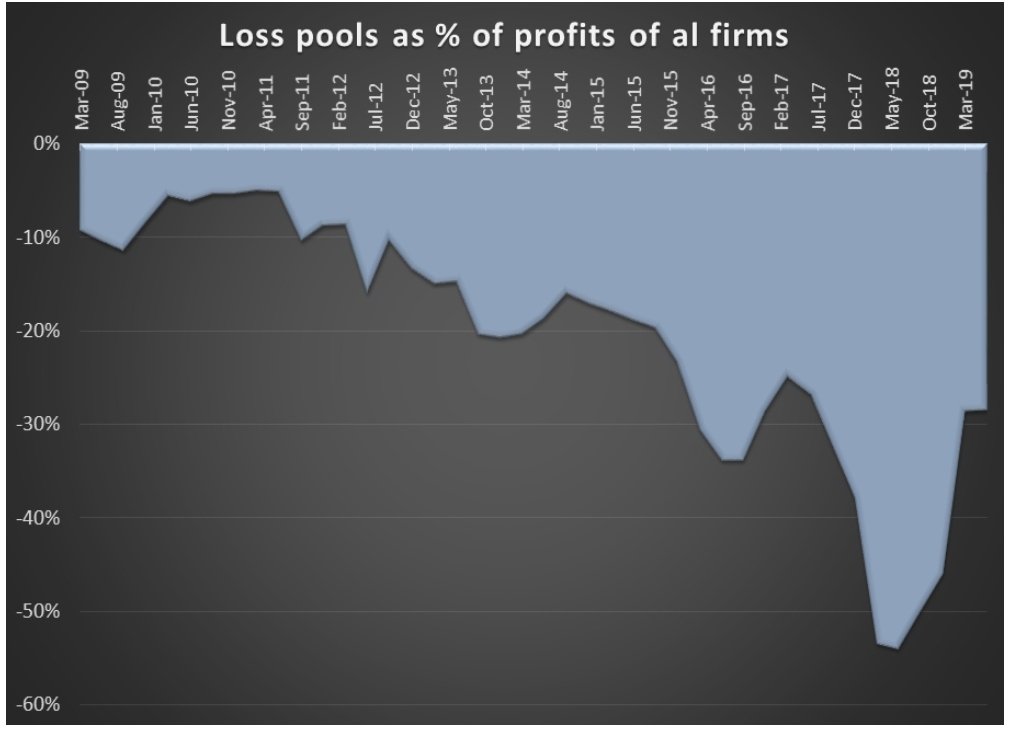
Thr hv been narratives arnd polarization, suggestive that only 20 firms account for 65-70% of profit share etc. I hv written bfr how such analysis are more optical due to burgeoning loss pools.

bit.ly/2QiXBBb
However,what is actually a manifestation of polarization is investment cycle.Share of Top 100 in overall listed India Inc capex surged from 40% to 70%,as previous cycle capital (mis) allocation meant many cos focus on right sizing B/S,& banks hesitant to grow beyond larger names
Trend #3: era of super giants - Polarization2.0.If one breaks all companies as belonging to 4 key cohorts (MNC/PSU/TOP 10 business houses/Rest of Private), one gets true sense of polarization.The top 10 biz houses are classified not on mkt cap or revenues, but on capex intensity
Share of these Top 10 biz houses has risen from 15% to 40% over last 2 decades! While few of them invested heavily pre 2013, many of them have persisted with significant investment post that too
These top 10 hv grown their capex by 19% CAGR over last 2 decades,with PSU capex growing at 10% & rest of pvt sector capex growth at 12%.5 of these Top 10 hv primarily invested in commodity related sectors,whereas other 5 hv deployed incremental dollar into many new biz verticals
Share of MNC has dropped significantly, both in salience as well as their capex to sales ratio.PSU capex has been steady,but most of this capex is into energy value chain, & with significant changes in anvil,will be interesting to see transformation of this capex to newer areas
Sectorally, there are 4 sectors in past that pulled capex to sales ratio from 2007-12 - telecom, real estate, utilities, transportation. Most other sectors have had a steady movement of capex to sales across last 2 decades
Trend #4: "capex" surge in private space

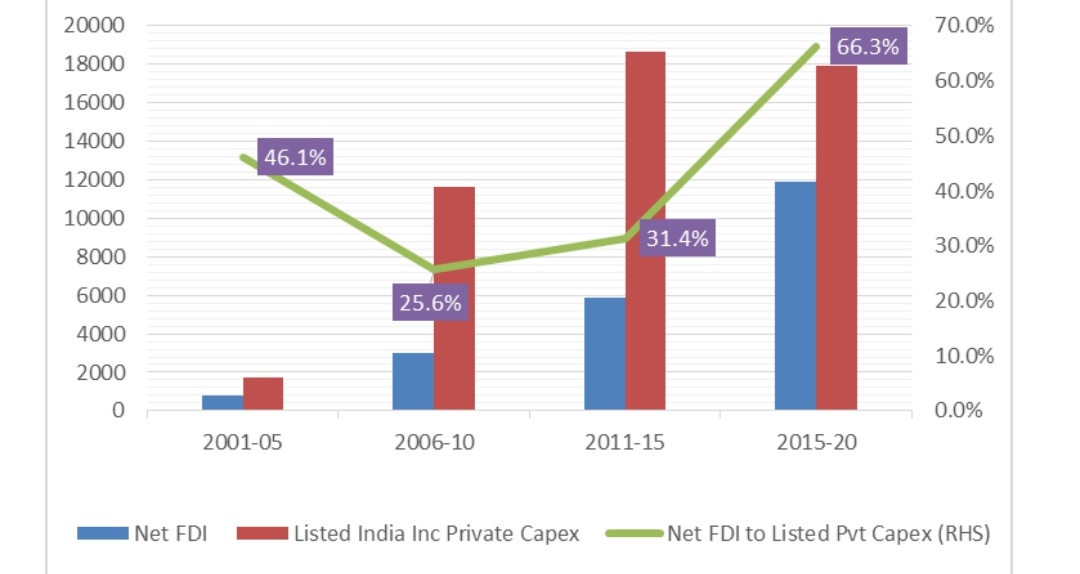
One proxy is to gauge net FDI and to see how it is attracting primarily to private space. Not all Net FDI goes into capex, some go into promoter buyout (esp REIT), some into loss funding and some into capex.
For most part of last so many decades, capital mkts were primary source of funding for most biz. However, last 10 years hv changed that dramatically, whr for a few years like 2018/19, net FDI was almost 80% of all listed private capex.
Over the last few years, India Inc has gone thru significant B/S repair, loss pools hv declined, and while thr may still be some more deleveraging reqd in some sectors, aggregate India Inc is in reasonably good shape to relook at investment plan outlays
"You sow what you reap"! Capital allocation is single most important decision for captains of India Inc, as an investment done right is source for future profit streams.Similarly, in fast paced disruptive world, thr is only so much cash flows to be milked from legacy investments
Cos that don't invest (& investment cd be intangibles, IP, R&D, talent etc)are likely to be even more marginalised in times to come, IMO, as they struggle to keep pace with larger companies out-investing as well as many private cos cmg mainstreamed in times to come
Lastly, this analysis is for listed space. From overall investment POV, household capex is an even larger constituent, and revival in that space can also get the overall capex cycle moving
Data source : Net FDI from RBI, US data from Bloomberg, data on listed companies from capitaline , raw data sourced from ICICI Securities
FIN!🙏
Of course, it shd read : " you reap what you sow" and not the other way around! 🙏

• • •

Missing some Tweet in this thread? You can try to force a refresh
 

Keep Current with Harish Krishnan,CFA

Harish Krishnan,CFA Profile picture

Stay in touch and get notified when new unrolls are available from this author!

Read all threads

This Thread may be Removed Anytime!

PDF

Twitter may remove this content at anytime! Save it as PDF for later use!

Try unrolling a thread yourself!

how to unroll video
  1. Follow @ThreadReaderApp to mention us!

  2. From a Twitter thread mention us with a keyword "unroll"
@threadreaderapp unroll

Practice here first or read more on our help page!

More from @hktg13

20 Jul
Fascinating to see the shape of US (sell 2y & buy 10 y) trade indicator - a gauge that aims to arrive at collective market view of long term inflation/economic recovery in US, while reducing near term noise/base effects etc
Are bond mkts signalling tht recovery ahead will be even more anaemic than previous decade (this cycle so far topping at 150bps as against 300 bps usually)? More imp,in the last few sessions, US2/10 has fallen below 100bps.Are we in for a muddle-through economy in decade ahead?
Or is it too premature to make that inference from bond market yet?
Read 6 tweets
29 May
Cash-in-Circulation (CiC) dynamics- thr is a myth that RBI has been printing new money significantly causing CiC to trend up,or people hoarding cash etc. With RBI annual report out,we hv detailed data on both CiC (denomination wise) as well as printing of notes from mint.
As can be seen, growth rates are stable. Of course, this is gross new notes printed by mint. Given we have CiC denomination wise from 2 years, we can also calculate the notes extinguished or withdrawn from circulation as well, and what matters is net supply by RBI to economy
Net supply has been lower like in the past few years,however, if we slice the data on High Value Denomination (HVD) (500/1000/2000), one gets a slightly different picture.

Net supply of HVD Notes have grown at faster clip in FY21, even as gross supply of HVD has slower growth
Read 11 tweets
1 Aug 20
Seeing quite a few posts on record high P/E ratios etc of Indian equities. Small theoretical exercise to potentially highlight the optical nature of a ratio like trailing P/E ratio especially in context of a massive shock like Covid Image
Assume a 2 stock index, company A which is generally been a compounder & has a resilient biz model and company B which was barely growing and vulnerable to shocks (either high fixed costs or high debt)
Come the lockdown in March,A sees a sequential decline in profits,from June qtr & Sep qtr, YoY growth slowdown is even more sharper,bfr stabilising in Dec qtr & given low base of Mar 20,Mar 21 qtr YoY surges. Growth for year FY21 is at 17% compared to 20% it achieved pre-covid
Read 11 tweets
1 Aug 20
Extremely low odds of instant gratification vs significantly higher payoffs of delayed wealth creation!
Fascinated by lottery sales explosion in Kerala(last year was approx 12000cr).Over 79 million lottery tickets sold every week in the state which has a population of just 33 mn
Compare this to total net flow to equity mutual funds last year of 1500cr from Kerala!Former has such low odds of instant gratification while latter has demonstrable much higher odds of wealth creation if held for decades,& yet...
Kerala lotteries have grown at a phenomenal pace. In 2009-10, total revenue of kerala lotteries was 625cr (i.e revenues went up 20x in a decade), while profits have showed a similar trend (from about 100 cr to arnd 2500cr, net profit margin have been 21-24%,last few years)
Read 10 tweets
6 Jul 20
Thread on govt claims on our consumption!As citizens,imp to see how our consumer spends get paid to govt in form of taxes.While there r analysis on total tax paid to govt etc on fuel/car etc,idea is to look at total aggregate private consumption & see center+state indirect taxes!
It amazes me that over last 30 years toral taxes paid to govt from our consumer wallets is broadly been in a narrow range of 16-21%.we have seen service tax (1995),VAT(2005), GST(2017)- major changes of taxation in these 30 years, across multiple govts and biz cycles
Our consumer spends have massively changed over last 30 years,towards more affluent categories over time.One time settlement,compliance or lack of it have all been narrative that have made to headlines often.Yet optically it appears there hasn't been much change!
Read 12 tweets
24 May 20
Casual reading of this chart by @MilanV spins 2 popular narratives of day - 1 capture by few cos(regulatory capture,invincible moats etc) that they become larger.2 In polarised mkt,where few performing,so follows only handful co worth investing! Alternative narratives possible?
Looking under hood suggests alternate narratives!Listed universe(approx 5k cos)shows trend of top 20 profit share of all PAT of 5k cos going from 40%to 65%(2009-2019).But,plot top 20 cos profit share of profit pool of only profitable cos shows flattish trend at 43% over 10 years
So,rather than regulatory capture etc causing dominance of chosen few,top 20 share is function of how loss pools have moved.Large losses in banks,telcos,infra,overseas acquisition gone wrong etc meant aggregate loss pool has zoomed from single digits to 55% of total profit pools!
Read 7 tweets

Did Thread Reader help you today?

Support us! We are indie developers!


This site is made by just two indie developers on a laptop doing marketing, support and development! Read more about the story.

Become a Premium Member ($3/month or $30/year) and get exclusive features!

Become Premium

Too expensive? Make a small donation by buying us coffee ($5) or help with server cost ($10)

Donate via Paypal Become our Patreon

Thank you for your support!

Follow Us on Twitter!

:(