A good opinion piece in today's NYTimes marred by an unfortunate oversight. A world with 6x more coal use than today and 3x more emissions in 2100 is decidedly not "business as usual", it is an increasing implausible worst-case outcome. nytimes.com/2021/07/21/opi…
In this case its worth noting that the study the figure comes from does not refer to RCP8.5 as "business as usual", but rather "the highest warming scenario". The world is, thankfully, currently on track for something more similar to their modest emissions reductions scenario:
Of course, a 3C or 2.5C world of current policies or pledges and targets is not an outcome we want. There is an ever-growing gap between our emissions and what is needed to meet Paris Agreement goals. But exaggerating where we are likely headed today is counterproductive.
Also, its worth emphasizing that there are still tail risks of very high warming outcomes under more realistic warming scenarios. But we need to accurately discuss these, rather than misleadingly portraying them as most-likely outcomes in today's world:
Fascinating piece by @ezraklein in the @nytimes. Among the wide-ranging discussion is a mention of a silver lining: the world is on track for around 3C warming compared to the 4 to 5C that seemed likely a decade ago. Unfortunately, some caveats are needed: nytimes.com/2021/07/15/opi…
When we try to project future warming, we are really dealing with three separate sets of uncertainties. The first, which we can control, is our emissions. There we have had some good news; global coal use peaked back in 2013, and is now in structural decline according to the @IEA
This means that truly nightmarish scenarios – where global emissions double or triple by 2100 – seem a lot less likely today when clean energy sources are cheaper than fossil fuels at the margin in many places as @Peters_Glen and I discussed in @nature: nature.com/articles/d4158…
Solar has had remarkable success making clean energy cheap. But in California its increasingly a victim of its own success. In a major new report we find solar value in CA fell 37% since 2014, and explore race between value deflation and cost declines: thebreakthrough.org/articles/quant… 1/
California leads the world in solar installation. In 2019 it generated 19.2% of all of its electricity from solar, with 13% from utility scale solar and the remainder from distributed rooftop solar: 2/
Solar is intermittent, but predictably so. It always generates electricity when the sun is shining, and in sunny California does not experience that much day-to-day variability. Heres what California Independent System Operator (CAISO) gen looks like in a typical spring week: 3/
In the 2000s global CO2 emissions grew at 3% per year. Over the past decade, however, this slowed to only 1% per year.
In a new analysis we find that falling energy intensity of GDP and emissions intensity of energy were main drivers of this decline: thebreakthrough.org/issues/energy/… 1/
A useful (though imperfect) tool to decompose drivers of emissions is the Kaya identity; it represents emissions as a combination of population, economic growth per person, energy intensity of the economy, and carbon intensity of energy: en.wikipedia.org/wiki/Kaya_iden… 2/
We can use this identity to decompose the drivers of emissions growth during each year. It turns out, conveniently, the the growth rate of emissions is the sum of the growth rates of each of the underlying factors. Here are drivers of global emissions since 2000: 3/
Its a tad disconcerting that the CMIP6 multimodel mean (using the 41 unique models current available) for the scenario intended well-below 2C – SSP1-2.6 – gives more than 2C warming by 2100:
That said, there are reasons to somewhat discount some of the very high sensitivity models that drive the overall multimodel mean upwards since CMIP5: thebreakthrough.org/issues/energy/…
Today the media is reporting on leaked Second Order Drafts of the IPCC WG2 report, due out in early 2022. I won't comment on the substance of the draft, apart to note that substantial revisions are often made between second order and final versions of the report.
There is a real risk or misrepresentation or inaccurate reporting based on leaked drafts, given that others cannot reference the original source. For example, @AFP is inaccurately reporting that climate change caused "crop production to fall 4%-10% in the last 30 years".
Global crop yields increased substantially over the last 30 years. At the same time, climate changes likely resulted in lower yield growth than in a world without climate change. But thats a much more nuanced claim than readers would assume the IPCC is making based on reporting.
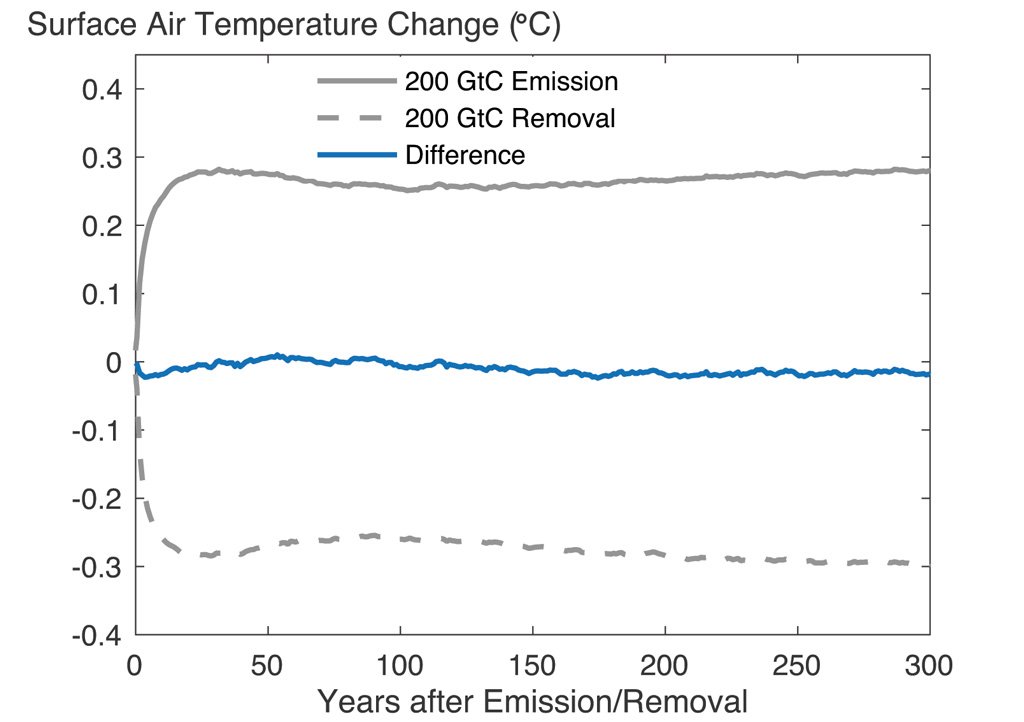
Great new paper by @KirstenZickfeld on the asymmetry of the effects on atmospheric concentration and temperatures between carbon additions and removals. She has an accessible explainer of the findings over at @CarbonBrief: carbonbrief.org/guest-post-why…
In short, they find that removing CO2 from the atmosphere is 3% to 18% less effective at reducing concentrations than adding it was in the first place, becoming less effective as more is removed. Thankfully the asymmetry for temperature are smaller – only 2% to 7% less:
None of this should suggest that carbon removals are not effective or needed; even if they were 20% less effective (at the extreme) than emissions additions, they would still be key to offset a long tail of hard to decarbonize activities.