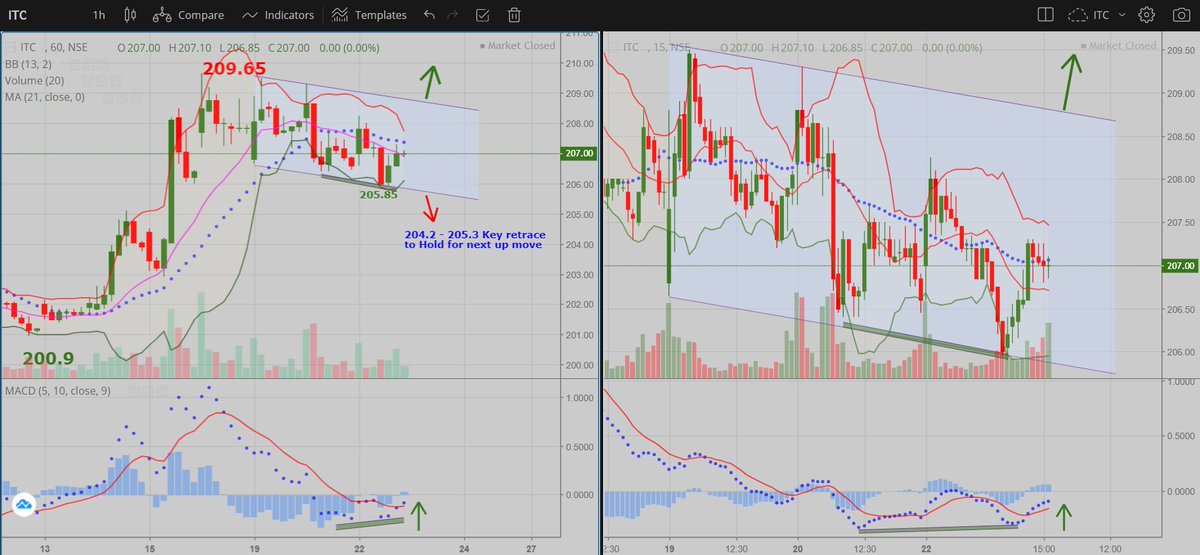
van ilango (JustNifty) Profile picture
Jul 23, 2021 16 tweets 7 min read Read on X
#Itc
having moved up from 200.9 to 209.65 (1st wave), consolidating in a "Flag pattern" so far.
Ahead of Q1 results, it could trade in "206 - 208.75" range.
Break out above "208.75" (for the 3rd wave/ "B" of 2).
View gets negated below "204-205" Image
#Itc
EW points out to low risk zones - 206.2-206.5 as (2)nd wave for targeting 208.5+ for (3)rd.

IF fails, you lose small; IF works, you gain big, LRHR. Image
#Itc
EW points out to low risk zone-206.2-206.5 as (2)nd - "Low done "206.5"
That's how you choose LRHR trades
This is 5 min t/f; choose in Hour or Day t/f a similar (1) & (2) set up, imagine the gain of (3)rd wave

Let us see IF this one does a good (3)rd of 5 min. t/f to 208.5 Image
#Itc
Develop the confidence to label each rise & fall - this way, you'll not get disturbed by a fall as you understand now that it's part of an upmove as long as it holds, a key retrace. Image
Now, you shift your SL based on the unfolding iiird wave..
Know the power of iii/ 3rd waves.
#Itc 205CE has given a gain of INR.1, which is INR.3200 on an investment of INR.10,000 - 32% gain so far. Image
#Itc
Hour chart which shows higher picture
IF holds 207 & move past 208.8, it is poised for a big move towards 215-220 by next week
Isn't that a LRHR trade
May work, may not but a well thought out trade plan is worked out based on week technical & EW
Waves may sub-divide too Image
#Itc waves are sub-dividing in iiird of (3) rd of 3rd
#Elliottwave no other study gives you such precision, such LRHR trades.
205CE is now up by INR.2, which is 64% return.
Remember, you have the "Choice" to stop this madness & take home money.
IF you have more lots, you could choose to part book & leave the rest with trailing SL.
Everyday many trains leave the station. You can choose to board any one of them.
"Choice" is always yours & yours only. Image
#Itc
As stated earlier the "iiird" wave sub-dividing and now for "iv"th... and then "v"th.. Image
#Itc the Big picture.
Coming out of a huge Triangle.
Triangles unleash big momentum once released. Image
#Itc
INR.6 in #Itc is a lottery, 206.5 to 212.5. And coming days will prove how lucky you're going to be. Image
Not much is being talked about "The Top gainer of the day". Image
Not much is being talked about "The Top gainer of the day", #ITC . Image
Now, it's being covered. Image

• • •

Missing some Tweet in this thread? You can try to force a refresh
 

Keep Current with van ilango (JustNifty)

van ilango (JustNifty) Profile picture

Stay in touch and get notified when new unrolls are available from this author!

Read all threads

This Thread may be Removed Anytime!

PDF

Twitter may remove this content at anytime! Save it as PDF for later use!

Try unrolling a thread yourself!

how to unroll video
  1. Follow @ThreadReaderApp to mention us!

  2. From a Twitter thread mention us with a keyword "unroll"
@threadreaderapp unroll

Practice here first or read more on our help page!

More from @JustNifty

Jul 22, 2022
#Priceaction
IF trader, then study "Hour chart" of at least 30 trading days
Watch how #prices are #Trending & you take a position when trend changes, say, from making "LH & LL" to "HL & HH" & Vice Versa
This is the 1st & foremost step & absolutely noiseless
#Retracement helps🙏 Image
#Priceaction Step:2
All traders know Demand & Supply to exploit the difference - a basic trait of any trader/ businessman.
What captures this absolutely is #Trendline & #Channel
For Eg: When prices break out of a falling T.Line/ Channel, it means demand has overpowered supply Image
That's first clue-buyers are asserting. LH & LL would soon change.
Next step is to look for a Fibonacci #retracement to hold @ 38% or 50% or 61.8% (to make HL) with a bullish candle like #Bullishengulfing or #Bullishpinbar @ a % of previous rise which is your perfect LRHR entry
Read 9 tweets
Jul 3, 2022
#Nifty
2 Scenarios likely.
In ST, both point towards a min. rise to 50DSma, 16200-250
c = a = 16255
#banknifty
2 Scenarios likely.
In ST, both point towards a min. rise to 50DSma, 34450
c = a = 34915
#Reliance
2 Scenarios likely.
In ST, both point towards a min. rise to 50DSma, 2615

50% - 61.8% #retracement of last fall from 2817 to 2365 @ 2591-2645
Read 5 tweets
Apr 18, 2022
#Nifty
Started last fall fm "17664" on 13th with 1 & 2
Would complete 3rd @ open @ 17220-263, then 4th & 5th.
Last fall #retracement from "17512 - 172xx"
MEma-17175
WLEma-17155
50DSma-17165
Pivot's S3-17195
VF's T6: 17197
IF correction, it must limit to 17220 @ open & then 17165
Based on significant gap down, the "revised trade levels" for the "day" & "Week".
#Nifty @ 17108-137 of VF's trade table's key level with a low of "17130"
Read 4 tweets
Mar 11, 2022
#Nifty
Index & most stocks done 3rd & 4th wave yesterday.
Holding approx. yesterday's low, "5th" wave to unfold today in opening session towards "16796-816".

Alt: Consolidation in most part of the day in yesterday's range.
#Nifty Trade plan:

1. keeping above “16465-485″ - "Low @ 16471" ---

---prices likely to head towards 16685-715 & above which 16910-925.
#Nifty
Pre-Market Observations:
1. "5th" wave unfolds holding yesterday's low 16448
2. A Broad trading range within yesterday's High & Low

Trade plan Buy @ 16465-485
1st Resistance : 16685-715

From 16471, high done 16673 so far.

Now, Holding "16545-575", up move continues..
Read 4 tweets
Mar 5, 2022
Macd is the simplest & most reliable indicators available. Macd uses Moving Averages & turn them into momentum indicator by subtracting longer MA from shorter MA. The subtracted value when plotted forms a line that oscillates above & below zero, without any upper/ lower limits. Image
Using shorter Moving Average (5 & 10) will produce a quicker, more responsive indicator (fast macd), while using longer MA (12 & 26) will produce a slower indicator (Slow macd), less prone to whipsaws.

Macd measures the difference between two Exponential Moving Averages (EMAs). Image
A +ve Macd indicates that 5 or 12-day Ema is trading above 10 or 26-day Ema. A -ve Macd indicates that 5 or 12-day Ema is trading below 10 or 26-day Ema. If Macd is -ve & declining, then -ve gap between faster MA & slower MA is expanding & Downward momentum is accelerating.. Image
Read 7 tweets
Dec 3, 2021
#Nifty
There are 2 Key retraces to follow for the Day.
1st is fm 17281 - 17420 @ 17330-350 (Aggressive)
2nd is fm 17064 - 17420 @ 17240-285(Conservative)

Based on Pivot tables,
17310-335 is a key support zone,
17470-500 is a key resistance zone.
#Nifty
There are 2 Key retraces to follow for the Day.
1st is fm 17281 - 17420 @ 17330-350 (Aggressive)
2nd is fm 17064 - 17420 @ 17240-285(Conservative)

Based on Pivot tables,
17310-335 is a key support zone,
17470-500 is a key resistance zone.
#Nifty
Based on Pivot tables,
17310-335 is a key support zone,
17470-500 is a key resistance zone.

Didn't get the "BUY" trade
BUT, a "Sell" trade emerged @ "17470-500" with a high of 17490 with OB readings and generated
100+ points with a low of "17362"
Read 6 tweets

Did Thread Reader help you today?

Support us! We are indie developers!


This site is made by just two indie developers on a laptop doing marketing, support and development! Read more about the story.

Become a Premium Member ($3/month or $30/year) and get exclusive features!

Become Premium

Don't want to be a Premium member but still want to support us?

Make a small donation by buying us coffee ($5) or help with server cost ($10)

Donate via Paypal

Or Donate anonymously using crypto!

Ethereum

0xfe58350B80634f60Fa6Dc149a72b4DFbc17D341E copy

Bitcoin

3ATGMxNzCUFzxpMCHL5sWSt4DVtS8UqXpi copy

Thank you for your support!

Follow Us!

:(