#Nifty seems to have done a 5 from 15579 to 15876.
Look at retrace: "15763" - 38%
78.6% retrace of 15962-15579 fall is "15880", high is 15876
Bearish view remains
However, the structure from 15579 to 15876 is of 5 waves & not "abc"
However, we keep a sl below 50% retrace of this rise @ 15728
Presently (2)nd wave unfolding holding "15725"
Keep both options open
Whenever you find 2 scenarios in play, wait for "resolution"
Aggressively, you could initiate a trade at critical reversal zone
For Eg: Rise fm 15769 was part of (iii)rd as per 1 scenario and 1st of that would pause at 15864-884 as per pivots. you sell & cover @ ivth, 15769
Don't think much. Plan based on simple objective observation of price pattern. Don't imagine things.
When you find a compelling pattern, initiate a trade, knowing fully that if fails, your risk is INR. xx & acceptable & then, plunge. Key in your target or an amt & end the trade.
#Itc
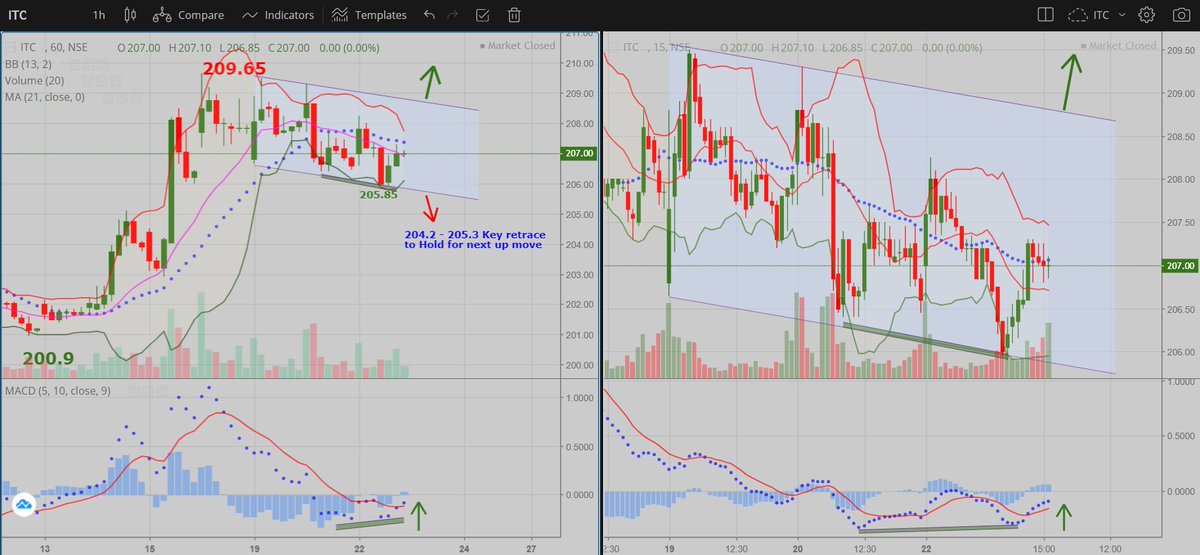
having moved up from 200.9 to 209.65 (1st wave), consolidating in a "Flag pattern" so far.
Ahead of Q1 results, it could trade in "206 - 208.75" range.
Break out above "208.75" (for the 3rd wave/ "B" of 2).
View gets negated below "204-205"
#Itc
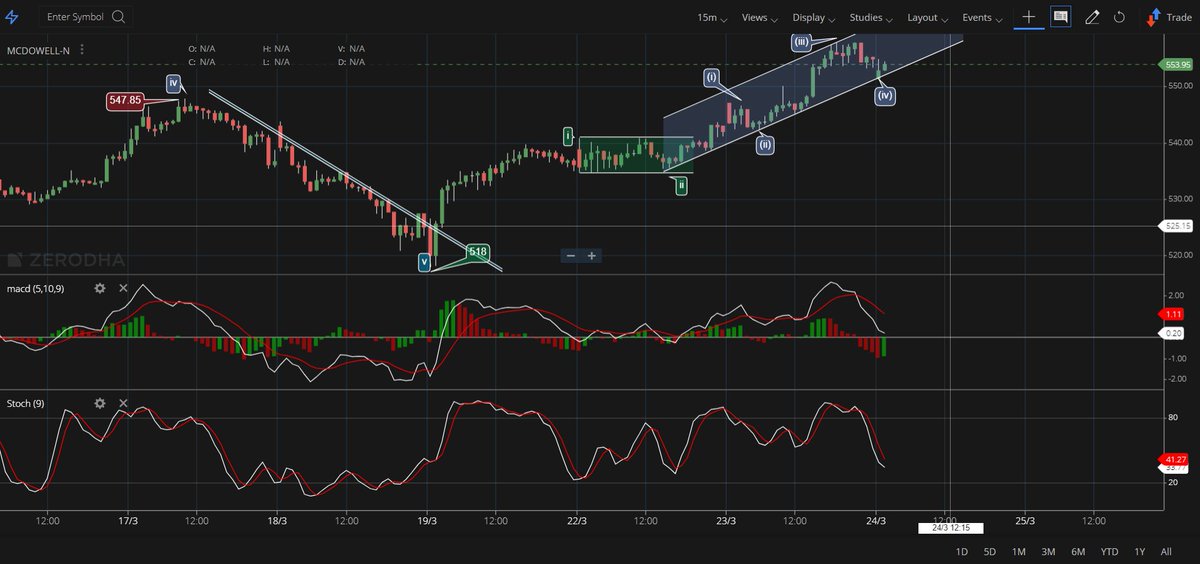
EW points out to low risk zones - 206.2-206.5 as (2)nd wave for targeting 208.5+ for (3)rd.
IF fails, you lose small; IF works, you gain big, LRHR.
#Itc
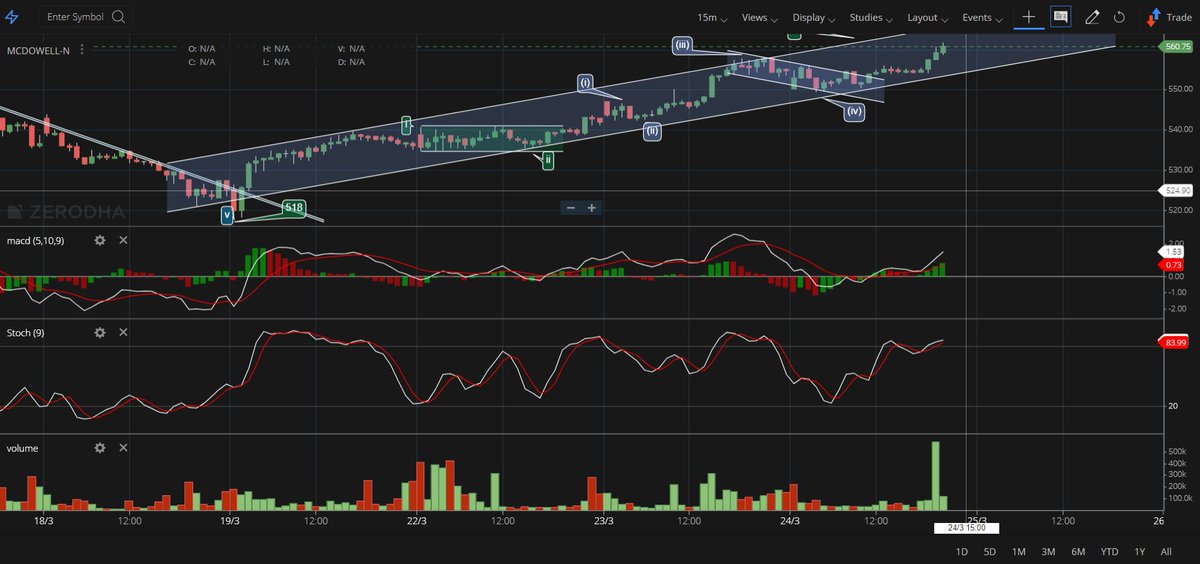
EW points out to low risk zone-206.2-206.5 as (2)nd - "Low done "206.5"
That's how you choose LRHR trades
This is 5 min t/f; choose in Hour or Day t/f a similar (1) & (2) set up, imagine the gain of (3)rd wave
Let us see IF this one does a good (3)rd of 5 min. t/f to 208.5
This Tech. tool keeps you on the right side. Take trades once this gives the go ahead. Until then, don't enter.
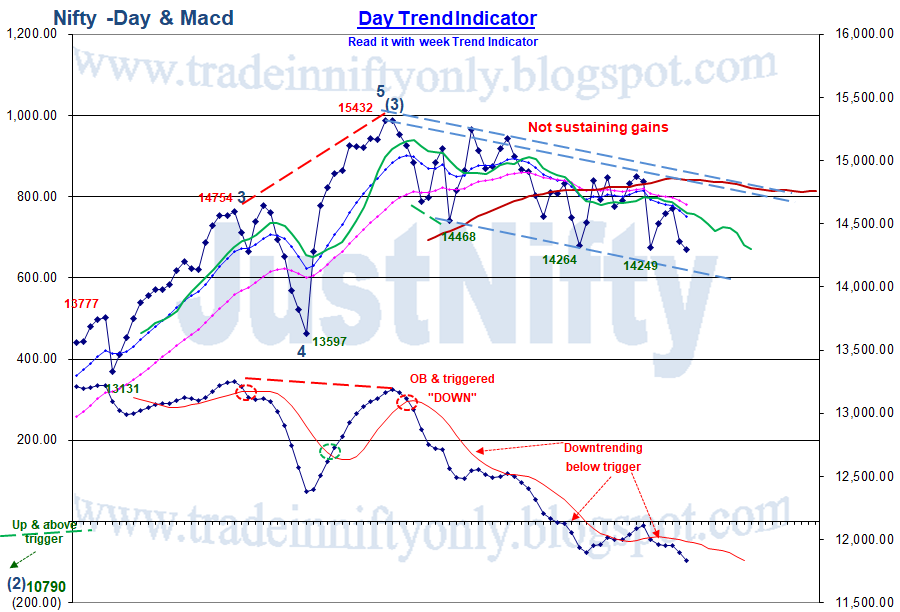
SLOW MACD(12,26,9) is a trend & momentum indicator.
S.MACD provides clear buy & sell signals using either "Turning dn or up & Triggering" as well as divergences.
Always start with higher t/f (WeeK) to align with the current forces. It does not mean, there won't be any counter trend moves for which you need to step down (Day & Hour).
Know the trade taken based on the t/f & accordingly stay for big move(week) or exit quickly (Hour)
Having followed most indicators (used to calculate formula & write dn & plot it in graph paper; hence, felt them), you just need S.Macd to make consistent money.
You don't need to make money every hour But like the fishermen, wait patiently for the signal, be it Hour/ day or week
Can one depend on Technical analysis signals for trading & expect to generate regular income? If TA helps you generate accurate signals with an annual return of 40%-50% then all the traders must be millionaires & no one would lose money, but that doesn’t seem to be the case. 1/n
So what are the limitations & how can one expect to EARN A LIVING BY TRADING
Larry Williams generated documented 100000% returns when he won Robbins Cup Trading Championship. He was teaching the EXACT Trading techniques & TA principles that he used in achieving these results
2/n
When asked during training If you are going to give away your secrets to everybody in the world, all will use them & if all will do the same, no one will get anything. So why are you giving it?
He said, " YOU ARE WRONG"! He further said, "EVERYONE WILL DO IT IS A CHIMERA!"
3/n
#Nifty on making a low of 14626 displays +ve divergence & has completed downside normal targets of Pivot & Camarilla tables.
#Nifty does a double +ve divergences.
As per pre-market plan, only a breach of 14595 would be bearish.
Low done 14603 & trading @ 14641... more to come holding 14610.
#Nifty divergences failed; 14610 broken.
Higher t/f - week's weak technical taking it's toll.
Heading towards lower end of BB/ Channel break...