#Itc
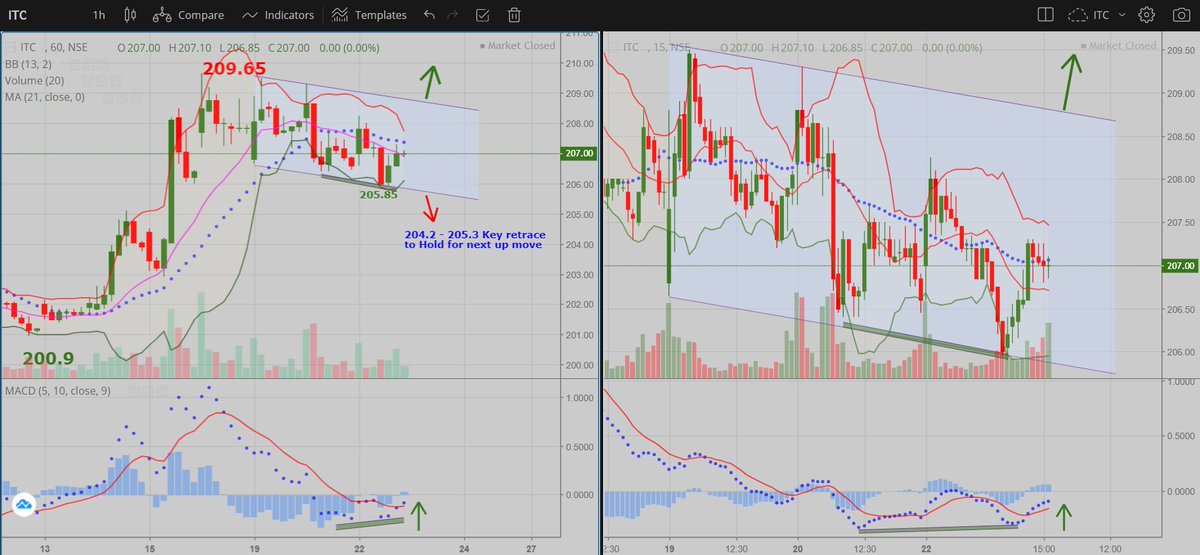
having moved up from 200.9 to 209.65 (1st wave), consolidating in a "Flag pattern" so far.
Ahead of Q1 results, it could trade in "206 - 208.75" range.
Break out above "208.75" (for the 3rd wave/ "B" of 2).
View gets negated below "204-205"
having moved up from 200.9 to 209.65 (1st wave), consolidating in a "Flag pattern" so far.
Ahead of Q1 results, it could trade in "206 - 208.75" range.
Break out above "208.75" (for the 3rd wave/ "B" of 2).
View gets negated below "204-205"

#Itc
EW points out to low risk zones - 206.2-206.5 as (2)nd wave for targeting 208.5+ for (3)rd.
IF fails, you lose small; IF works, you gain big, LRHR.
EW points out to low risk zones - 206.2-206.5 as (2)nd wave for targeting 208.5+ for (3)rd.
IF fails, you lose small; IF works, you gain big, LRHR.

#Itc
EW points out to low risk zone-206.2-206.5 as (2)nd - "Low done "206.5"
That's how you choose LRHR trades
This is 5 min t/f; choose in Hour or Day t/f a similar (1) & (2) set up, imagine the gain of (3)rd wave
Let us see IF this one does a good (3)rd of 5 min. t/f to 208.5
EW points out to low risk zone-206.2-206.5 as (2)nd - "Low done "206.5"
That's how you choose LRHR trades
This is 5 min t/f; choose in Hour or Day t/f a similar (1) & (2) set up, imagine the gain of (3)rd wave
Let us see IF this one does a good (3)rd of 5 min. t/f to 208.5

#Itc
Develop the confidence to label each rise & fall - this way, you'll not get disturbed by a fall as you understand now that it's part of an upmove as long as it holds, a key retrace.
Develop the confidence to label each rise & fall - this way, you'll not get disturbed by a fall as you understand now that it's part of an upmove as long as it holds, a key retrace.

Now, you shift your SL based on the unfolding iiird wave..
Know the power of iii/ 3rd waves.
#Itc 205CE has given a gain of INR.1, which is INR.3200 on an investment of INR.10,000 - 32% gain so far.
#Itc 205CE has given a gain of INR.1, which is INR.3200 on an investment of INR.10,000 - 32% gain so far.

#Itc
Hour chart which shows higher picture
IF holds 207 & move past 208.8, it is poised for a big move towards 215-220 by next week
Isn't that a LRHR trade
May work, may not but a well thought out trade plan is worked out based on week technical & EW
Waves may sub-divide too
Hour chart which shows higher picture
IF holds 207 & move past 208.8, it is poised for a big move towards 215-220 by next week
Isn't that a LRHR trade
May work, may not but a well thought out trade plan is worked out based on week technical & EW
Waves may sub-divide too

#Itc waves are sub-dividing in iiird of (3) rd of 3rd
#Elliottwave no other study gives you such precision, such LRHR trades.
205CE is now up by INR.2, which is 64% return.
205CE is now up by INR.2, which is 64% return.
Remember, you have the "Choice" to stop this madness & take home money.
IF you have more lots, you could choose to part book & leave the rest with trailing SL.
Everyday many trains leave the station. You can choose to board any one of them.
"Choice" is always yours & yours only.
IF you have more lots, you could choose to part book & leave the rest with trailing SL.
Everyday many trains leave the station. You can choose to board any one of them.
"Choice" is always yours & yours only.

#Itc
INR.6 in #Itc is a lottery, 206.5 to 212.5. And coming days will prove how lucky you're going to be.
INR.6 in #Itc is a lottery, 206.5 to 212.5. And coming days will prove how lucky you're going to be.

Not much is being talked about "The Top gainer of the day", #ITC . 

• • •
Missing some Tweet in this thread? You can try to
force a refresh


