Summer 2021 has seen record heat waves (and the hottest June on record over land regions), as well as extreme flooding. In our Q2 2021 State of the Climate update, we look back at the first six months of the year and what the next six months may hold: carbonbrief.org/state-of-the-c… Image
Despite record summer heat in some areas, globally the year has been a bit cooler than the last few so far; 2021 is the seventh warmest year on record to-date. That still means its warmer than all but seven years since record began in the mid-1800s! Image
Here is 2021 to-date in context of the long-term warming across the five major global temperature records (NASA, NOAA, Hadley/UEA, Berkeley Earth, and Copernicus/ECMWF): Image
Based on the first six months of the year and the El Nino/La Nina forecast, we can estimate where 2021 will end up. We find that it will very likely be somewhere between the 5th and 7th warmest year on record, consistent with the long-term warming trend: Image
This suggests that the remaining months of the year will likely be a bit warmer (in terms of temperature anomalies) than the first six months of the year, driven in part by the fading La Nina event that drove down early 2021 temperatures: Image
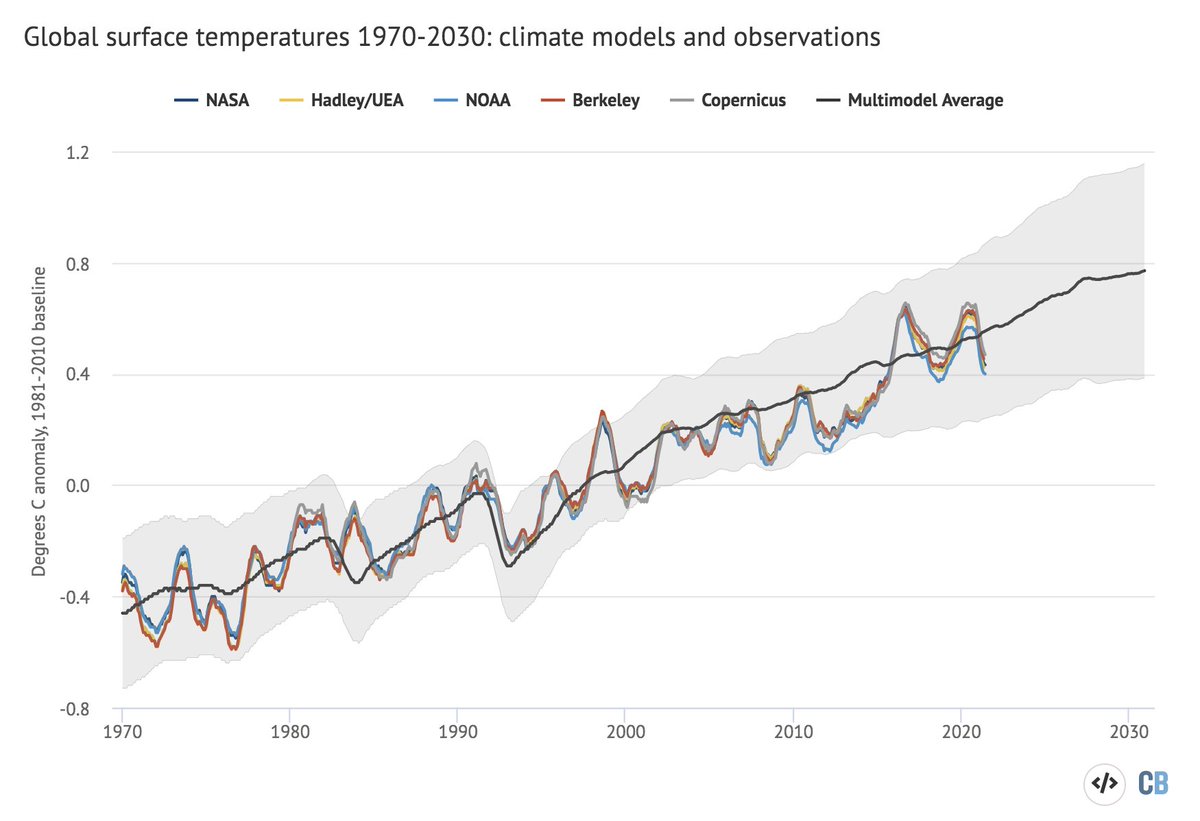
Global temperatures are pretty well in-line with where climate models in the last IPCC report (published in 2013) projected they would be: Image
Finally, Arctic sea ice has been at record lows for this time of the year for much of July, though it is too early to tell what the September sea ice minimum will end up being. Antarctic sea ice has been pretty normal (relative to the 1981-2010 period) so far this year: Image
For more details (and more on recent climate extremes), read the Q2 2021 State of the Climate article: carbonbrief.org/state-of-the-c…

• • •

Missing some Tweet in this thread? You can try to force a refresh
 

Keep Current with Zeke Hausfather

Zeke Hausfather Profile picture

Stay in touch and get notified when new unrolls are available from this author!

Read all threads

This Thread may be Removed Anytime!

PDF

Twitter may remove this content at anytime! Save it as PDF for later use!

Try unrolling a thread yourself!

how to unroll video
  1. Follow @ThreadReaderApp to mention us!

  2. From a Twitter thread mention us with a keyword "unroll"
@threadreaderapp unroll

Practice here first or read more on our help page!

More from @hausfath

22 Jul
The world is on track for warming of around 3C above preindustrial levels by 2100 under policies in place today. This piece in the @TheEconomist does a good job of exploring the severe impacts that level of warming could have for human and natural systems: economist.com/briefing/2021/…
This reflects ongoing work to fill in an important gap: much of the climate impacts literature has historically focused on worst-case emissions outcomes of around 4C warming, or outcomes of well-below 2C where we meet Paris Agreement goals.
Of course, the climate system is uncertain. We could well end up at 4C or more warming (or get lucky and have closer to 2C). These tail risks – perhaps more than the impacts at 3C itself – provide a strong incentive for more rapid mitigation.
Read 4 tweets
21 Jul
A good opinion piece in today's NYTimes marred by an unfortunate oversight. A world with 6x more coal use than today and 3x more emissions in 2100 is decidedly not "business as usual", it is an increasing implausible worst-case outcome. nytimes.com/2021/07/21/opi…
In this case its worth noting that the study the figure comes from does not refer to RCP8.5 as "business as usual", but rather "the highest warming scenario". The world is, thankfully, currently on track for something more similar to their modest emissions reductions scenario:
For more details, see my piece with @Peters_Glen in @Nature last year: nature.com/articles/d4158…
Read 6 tweets
15 Jul
Fascinating piece by @ezraklein in the @nytimes. Among the wide-ranging discussion is a mention of a silver lining: the world is on track for around 3C warming compared to the 4 to 5C that seemed likely a decade ago. Unfortunately, some caveats are needed: nytimes.com/2021/07/15/opi…
When we try to project future warming, we are really dealing with three separate sets of uncertainties. The first, which we can control, is our emissions. There we have had some good news; global coal use peaked back in 2013, and is now in structural decline according to the @IEA
This means that truly nightmarish scenarios – where global emissions double or triple by 2100 – seem a lot less likely today when clean energy sources are cheaper than fossil fuels at the margin in many places as @Peters_Glen and I discussed in @nature: nature.com/articles/d4158…
Read 10 tweets
14 Jul
Solar has had remarkable success making clean energy cheap. But in California its increasingly a victim of its own success. In a major new report we find solar value in CA fell 37% since 2014, and explore race between value deflation and cost declines: thebreakthrough.org/articles/quant…
1/
California leads the world in solar installation. In 2019 it generated 19.2% of all of its electricity from solar, with 13% from utility scale solar and the remainder from distributed rooftop solar: 2/
Solar is intermittent, but predictably so. It always generates electricity when the sun is shining, and in sunny California does not experience that much day-to-day variability. Heres what California Independent System Operator (CAISO) gen looks like in a typical spring week: 3/
Read 20 tweets
8 Jul
In the 2000s global CO2 emissions grew at 3% per year. Over the past decade, however, this slowed to only 1% per year.

In a new analysis we find that falling energy intensity of GDP and emissions intensity of energy were main drivers of this decline: thebreakthrough.org/issues/energy/…
1/
A useful (though imperfect) tool to decompose drivers of emissions is the Kaya identity; it represents emissions as a combination of population, economic growth per person, energy intensity of the economy, and carbon intensity of energy: en.wikipedia.org/wiki/Kaya_iden… 2/
We can use this identity to decompose the drivers of emissions growth during each year. It turns out, conveniently, the the growth rate of emissions is the sum of the growth rates of each of the underlying factors. Here are drivers of global emissions since 2000: 3/
Read 21 tweets
1 Jul
Its a tad disconcerting that the CMIP6 multimodel mean (using the 41 unique models current available) for the scenario intended well-below 2C – SSP1-2.6 – gives more than 2C warming by 2100:
That said, there are reasons to somewhat discount some of the very high sensitivity models that drive the overall multimodel mean upwards since CMIP5: thebreakthrough.org/issues/energy/…
Lots of other recent papers making this point:
Read 4 tweets

Did Thread Reader help you today?

Support us! We are indie developers!


This site is made by just two indie developers on a laptop doing marketing, support and development! Read more about the story.

Become a Premium Member ($3/month or $30/year) and get exclusive features!

Become Premium

Too expensive? Make a small donation by buying us coffee ($5) or help with server cost ($10)

Donate via Paypal Become our Patreon

Thank you for your support!

Follow Us on Twitter!

:(