🚨new results on the effect of UI supplements on job-finding 🚨
2 designs x 2 policy changes yield consistent pattern: small, precisely estimated disincentive effects
Disincentive remains small even after job openings up
2 designs x 2 policy changes yield consistent pattern: small, precisely estimated disincentive effects
Disincentive remains small even after job openings up
An overarching theme of the pandemic has been to view the supplements as responsible for the biggest problems (slow employment recovery, usually conservatives) and the biggest successes (rising wages at the bottom, usually liberals).
Our results are inconsistent with both views.
Our results are inconsistent with both views.
Instead, it makes sense to think of the effects of pandemic UI primarily as an ambitious anti-poverty policy. I can’t think of a time before when a country gave *full* insurance to earnings losses (examples welcome in the comments)
“Micro and Macro Disincentive Effects of Expanded Unemployment Benefits”
Joint w @FionaGreigDC @pascaljnoel @Dan_M_Sullivan @JoeVavra
Updates our analysis from Feb of the disincentive.
voices.uchicago.edu/ganong/files/2…
Joint w @FionaGreigDC @pascaljnoel @Dan_M_Sullivan @JoeVavra
Updates our analysis from Feb of the disincentive.
voices.uchicago.edu/ganong/files/2…

Why would we use bank data to study this question?
* 1.2 million spells, so our estimates much more precise than survey data
* trace out effects of policies week by week
* observe people actually getting benefits
* separate recalls from new job starts
* 1.2 million spells, so our estimates much more precise than survey data
* trace out effects of policies week by week
* observe people actually getting benefits
* separate recalls from new job starts
What’s new? Last time we produced estimates from expiration of $600 which relied heavily on a structural model. Now our estimates rely on more traditional applied micro assumptions.
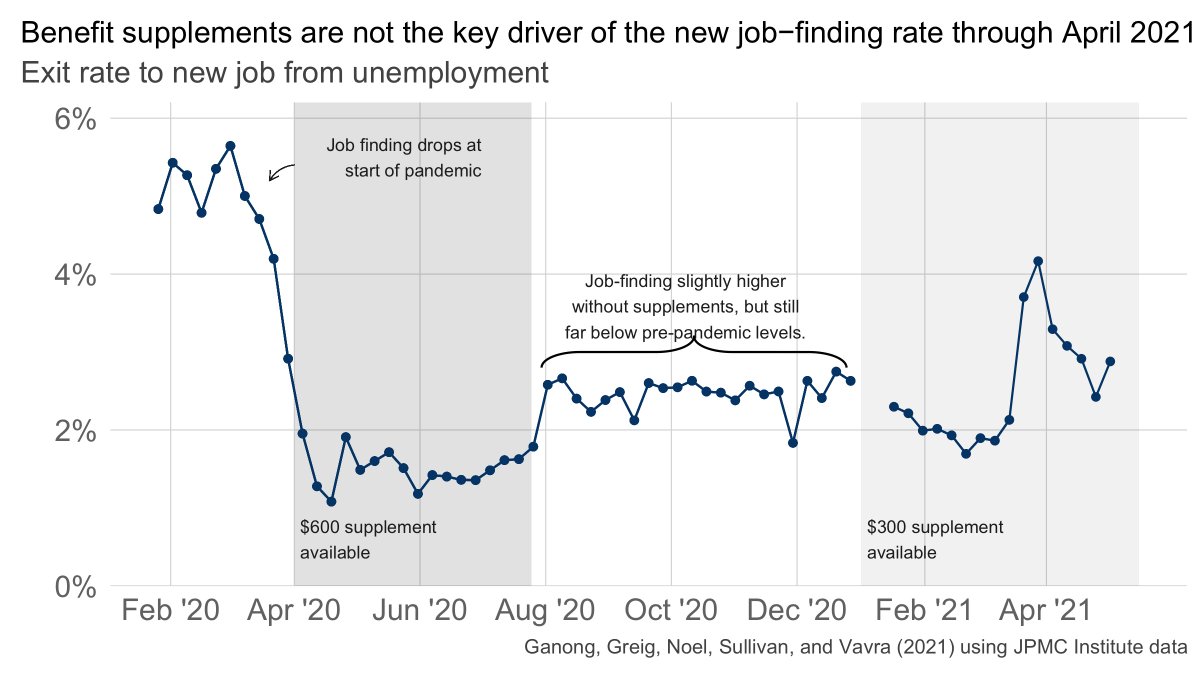
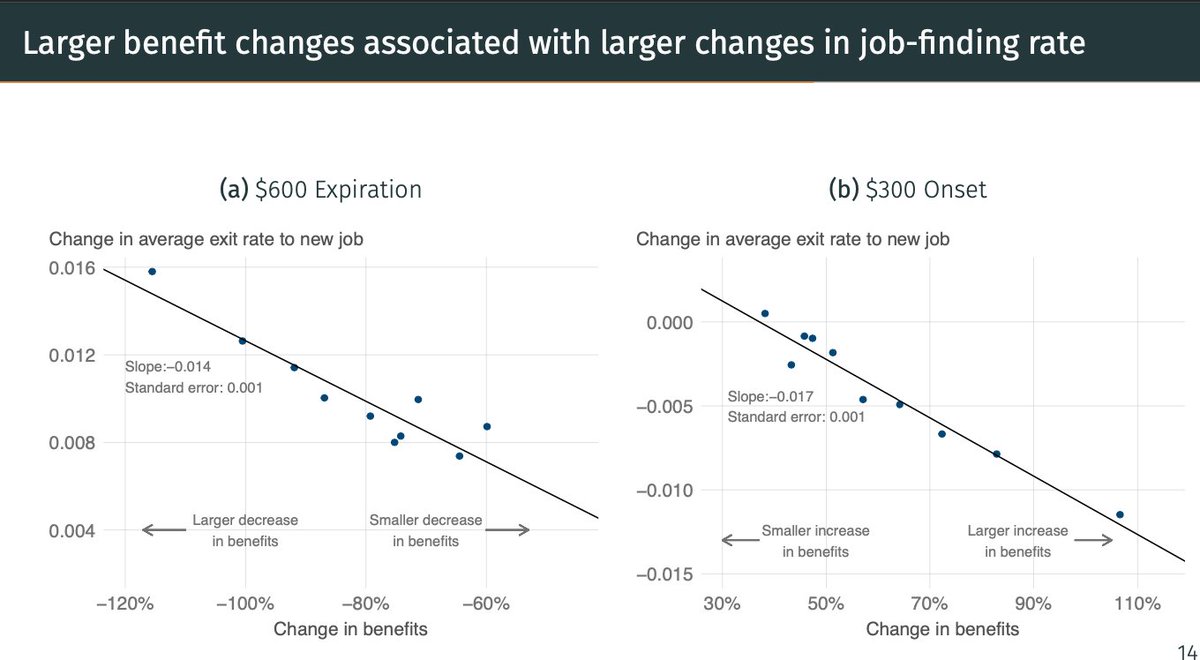
First we look at the “macro” effect (the effect of increasing benefits for all workers)
Small increase in the job-finding rate when $600 expires and small decrease at $300 onset
Small increase in the job-finding rate when $600 expires and small decrease at $300 onset

Small effect is precisely estimated: p-value of .03 if timing of policy change is random

Second we look at the “micro” effect (the effect of increasing benefits for one worker)
Idea: $300 raises replacement rates most for low-inc workers. Compare workers with higher and lower replacement rates from the $300
Idea: $300 raises replacement rates most for low-inc workers. Compare workers with higher and lower replacement rates from the $300
Three key lessons:
1. Modest disincentive effect
2. Even with replacement rates > 100%, many workers continue to find jobs.
3. No evidence that disincentive effects grow over time (diff btw dark blue and light blue lines is roughly constant)
1. Modest disincentive effect
2. Even with replacement rates > 100%, many workers continue to find jobs.
3. No evidence that disincentive effects grow over time (diff btw dark blue and light blue lines is roughly constant)

Prior plot defines treatment as binary. Can instead use a continuous measure.
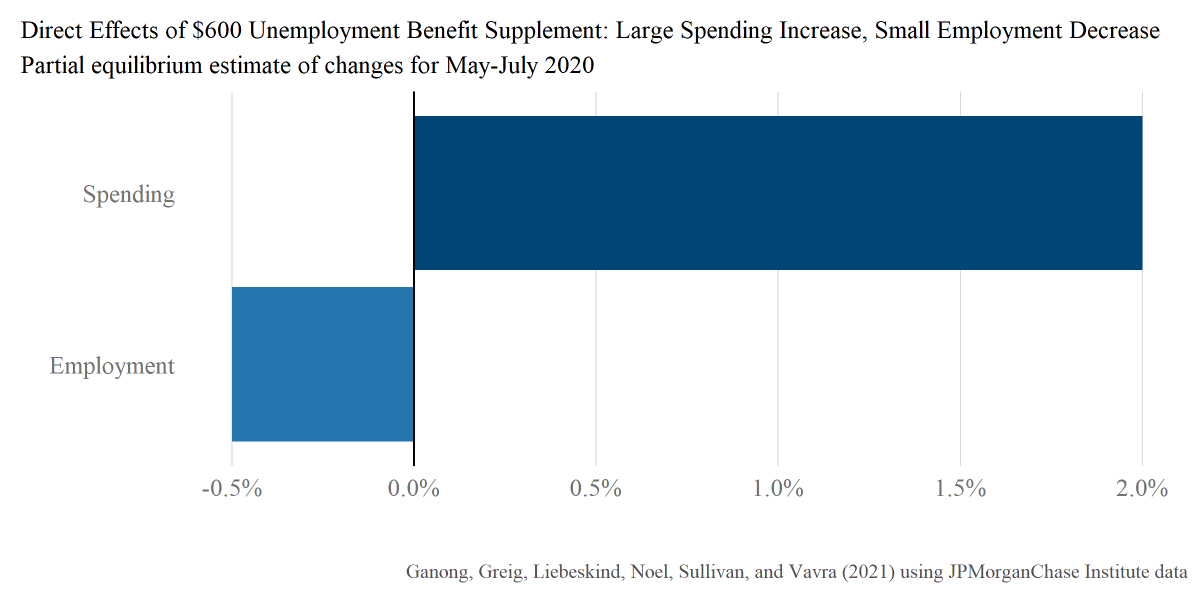
Altogether we find that the supplements reduce the job-finding rate by 0.6 p.p. to 1.1 p.p. per week.
Employment effects -0.2% to -0.6%. Thus UI has *not* been responsible for the slow employment recovery.
Employment effects -0.2% to -0.6%. Thus UI has *not* been responsible for the slow employment recovery.

The disincentive effect during the pandemic is at the very low end of estimates from the prior literature

In spring of 2021, “the sun came up”. A huge change in macro conditions. Job openings soared. Vaccines broadly available.

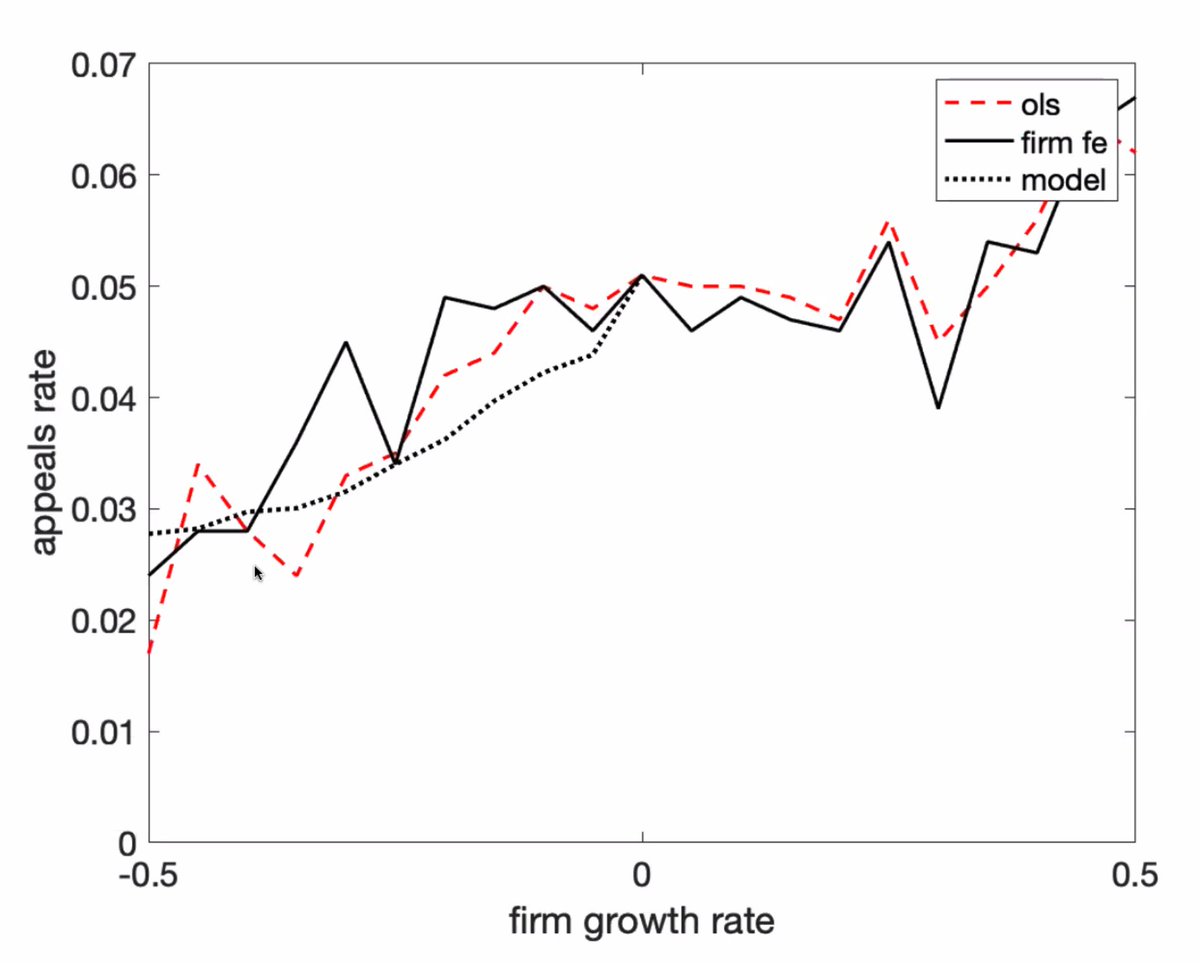
Is the disincentive effect larger once job openings up and vaccines broadly available? No.
This result is more speculative since it relies on (a) no differential trends assumption holding over a long time period and (b) inclusion of state / industry fixed effects as a control
This result is more speculative since it relies on (a) no differential trends assumption holding over a long time period and (b) inclusion of state / industry fixed effects as a control

Finally, reservation wages (and accepted wages) are way up in the recession.
A common view is to attribute this to the effects of UI.
A common view is to attribute this to the effects of UI.
https://twitter.com/p_ganong/status/1420502702111526917?s=20
In qualitative terms, I think the available data are inconsistent with this
1. Improbable that UI could NOT have much effect on emp but WOULD still be pushing up res wages by 25%
2. Other measures of labor *demand* are up too
(h/t @Simon_Mongey for helping me to think thru this)
1. Improbable that UI could NOT have much effect on emp but WOULD still be pushing up res wages by 25%
2. Other measures of labor *demand* are up too
(h/t @Simon_Mongey for helping me to think thru this)
The labor market is hot and pandemic UI doesn't currently seem to be a big driver of the challenges (low employment growth) or the successes (high wage growth)
Caveats:
* Analysis above is only for new jobs. We haven’t quantified effect on recalls yet
* Effects only measured through mid-May
* Analysis above is only for new jobs. We haven’t quantified effect on recalls yet
* Effects only measured through mid-May
* Supplements are one part of pandemic UI. Other two parts are longer benefits (PEUC) and new eligibility (PUA). I expect there to be a lot of studies looking at states that cut off pandemic UI early. So far it looks like a *noisy* zero.
https://twitter.com/p_ganong/status/1416160296201334786?s=20
We are still working on this project, would love to hear your comments!
We also released a report on PUA today, details here
https://twitter.com/p_ganong/status/1420729001472049152?s=20
• • •
Missing some Tweet in this thread? You can try to
force a refresh