Millions of people have had federal UI benefits cut off
Stated goal: speed the labor market recovery.
Is it working?
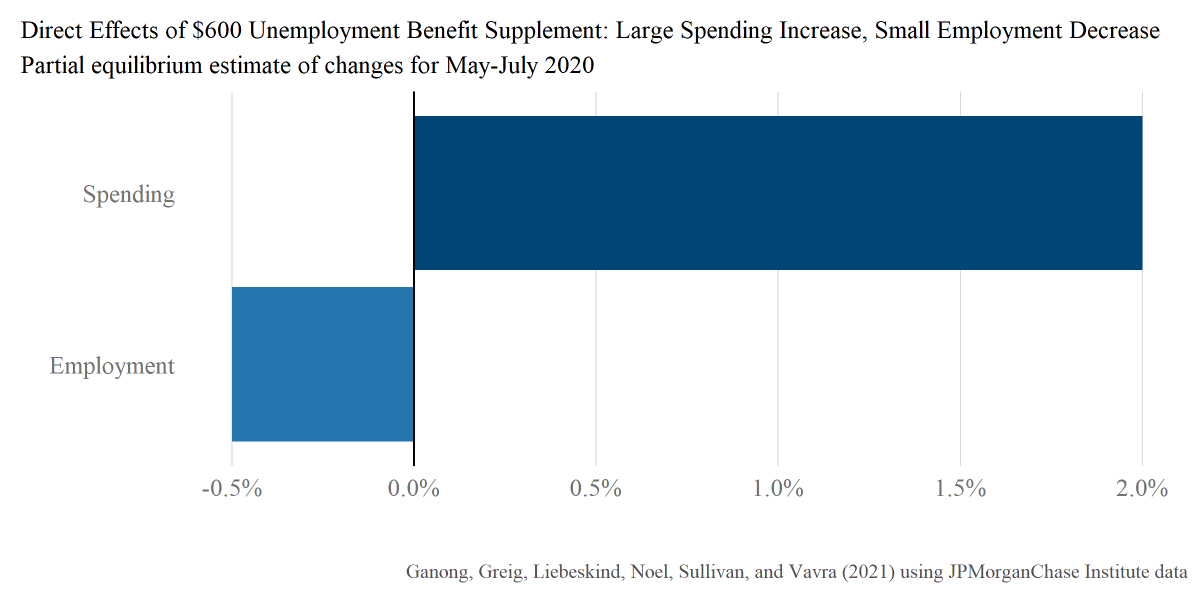
Tldr: It’s going to be really hard to use state employment data to do a good job of answering this question.
Looks like a noisy 0
Stated goal: speed the labor market recovery.
Is it working?
Tldr: It’s going to be really hard to use state employment data to do a good job of answering this question.
Looks like a noisy 0

So far, 26 governors have announced plans to cut off at least some federal benefits. 20 are cutting off all benefits by July 5. This is where we might expect to see the biggest effects.
In those states, over 1 million people had their benefits fully cut off and another 1+ million people lost the supplement by July 5.
Stated goal: speed the labor market recovery.
Is it working?
Today was our first real shot at answering this question.
Is it working?
Today was our first real shot at answering this question.
What makes today special? We get state payroll data, so we can compare June employment in states that cut off benefits and states that did not.
The new data capture employment during the payroll period containing June 12.
The new data capture employment during the payroll period containing June 12.

The natural thing is to compare all states that cut off benefits with all states that didn’t. These states differ in important ways!
States that cut off benefits (red) had a smaller initial employment decline and therefore less distance to travel in the subsequent recovery. Blue non-terminating states have been recovering faster since December, but they also have more distance to travel. 

In econ speak, the parallel trends assumption required by a DiD fails.
Can one still learn from the comparisons by state? Yes, at least a bit, by using the partial identification approach advocated by @jondr44 and @asheshrambachan.
Can one still learn from the comparisons by state? Yes, at least a bit, by using the partial identification approach advocated by @jondr44 and @asheshrambachan.
I consider two cases:
1. Parallel trends holds from May to June
2. Difference in trends from January to May continues into June
I interpret these cases as giving lower and upper bound point estimates. Then there’s sampling variation as well.
1. Parallel trends holds from May to June
2. Difference in trends from January to May continues into June
I interpret these cases as giving lower and upper bound point estimates. Then there’s sampling variation as well.
Caveat 1: unclear whether we should expect to see effects in June. If a worker starts a job on June 26, their new job almost certainly not captured by this data release.
Caveat 2: If a PUA recipient returns to self-employment, this won’t be captured at all.
Taking into account both types of uncertainty, I get a range from -129K to +117K for the impact of terminations on employment. 

This confidence interval is certainly too small. For example, look at Nov -> Dec 2020: emp grows in red states relative to blue. But there is no UI policy change then (perhaps the states differ by shutdowns?). Whatever the source of diff'l shocks, true uncertainty is higher.
I tried using other state groupings (e.g. adding the six states with partial cut offs to the red group to get to 26 states). 

This makes it look like terminations have a more positive effect. But probably just noise -- the states I'm adding are ones that are maintaining PEUC and PUA, so expect *smaller* employment effects, not bigger.
I suppose if I were more clever, I would have done all the pre-analysis before jobs day and then told #econtwitter even before the #s came out that a state-by-state design will not yield a clear answer.
Better late than never.
Better late than never.
Some of the comments say "wow, no effect of terminations!".
This is *not* the right interpretation.
Rather, I think the thread is consistent with both large positive and large negative impacts of the terminations.
This is *not* the right interpretation.
Rather, I think the thread is consistent with both large positive and large negative impacts of the terminations.
• • •
Missing some Tweet in this thread? You can try to
force a refresh


