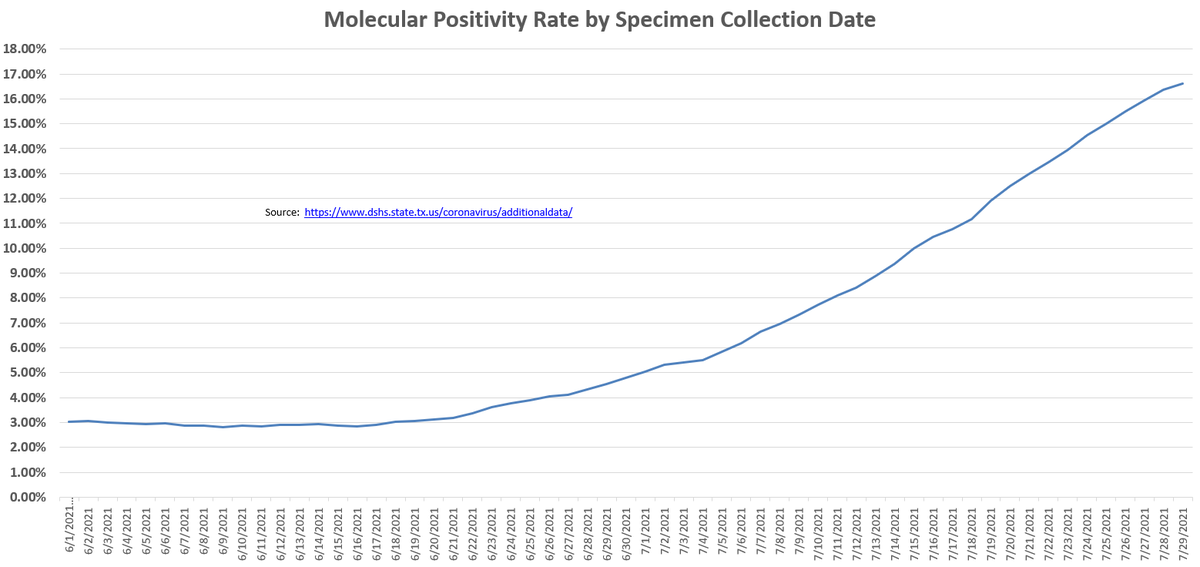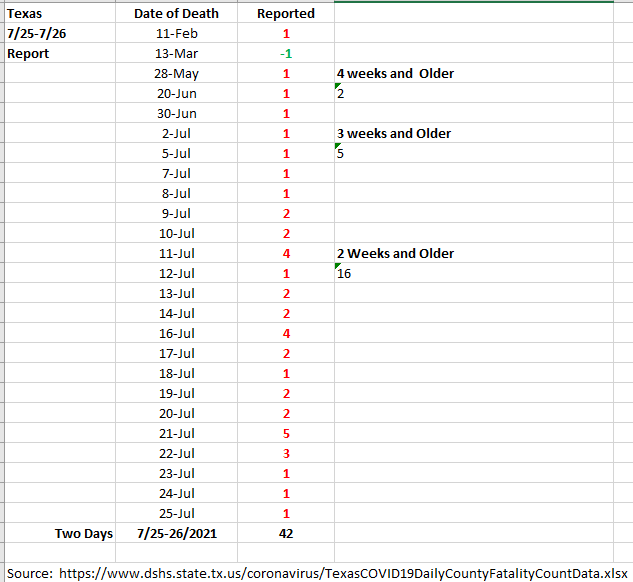
As mentioned yesterday, 35 reported C19 deaths for the day. The breakdown of those 35 is below as is the main hospitalization over fatalities Chart. The divergence at the far right is due to fatality arrivals to the state, and what appears to be reduced lethality of Delta
1/n
.

1/n
.
https://twitter.com/therealarod1984/status/1420829249297059844


How am I making this still very early assertion about Delta's lethality? Several reasons to combine to explain:
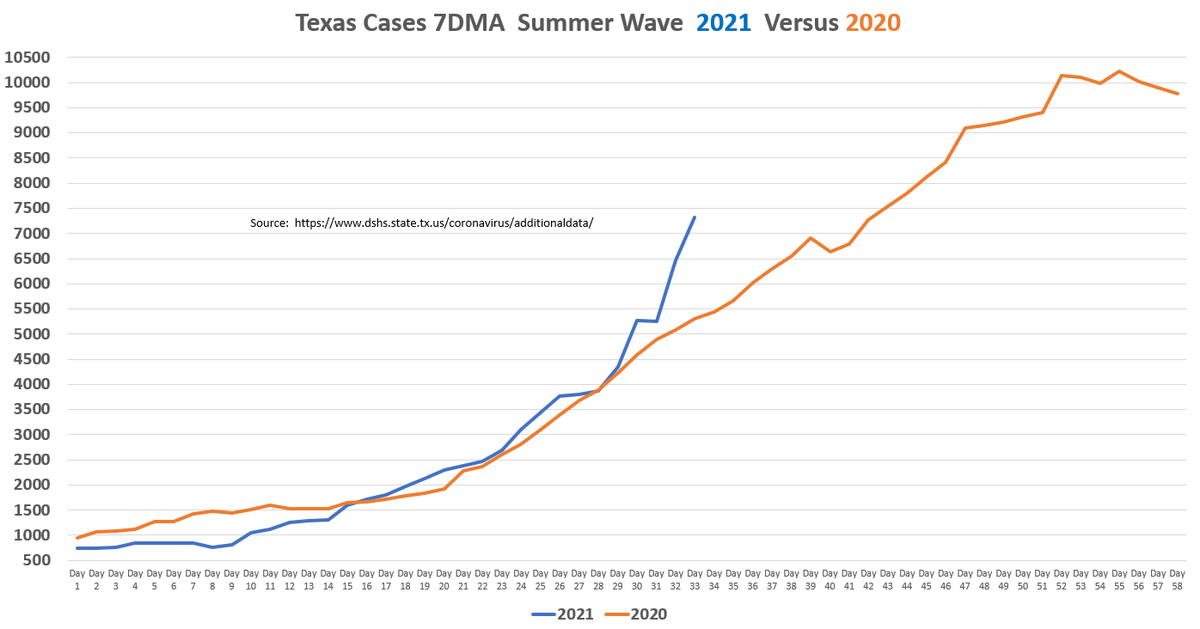
1) Per my other daily thread the 2021 summer wave is almost identical thus far to the 2020 summer wave, 13 months apart, from a case & hospitalization perspective
2/n

1) Per my other daily thread the 2021 summer wave is almost identical thus far to the 2020 summer wave, 13 months apart, from a case & hospitalization perspective
2/n


2 days ago, I posted this thread regarding projection of fatality arrivals to the state, the model I built & how the actuals over the 1st week of this project were coming in below projections. Its a solid model built off past Texas reporting.
3/n
3/n
https://twitter.com/therealarod1984/status/1420362943825338376?s=20
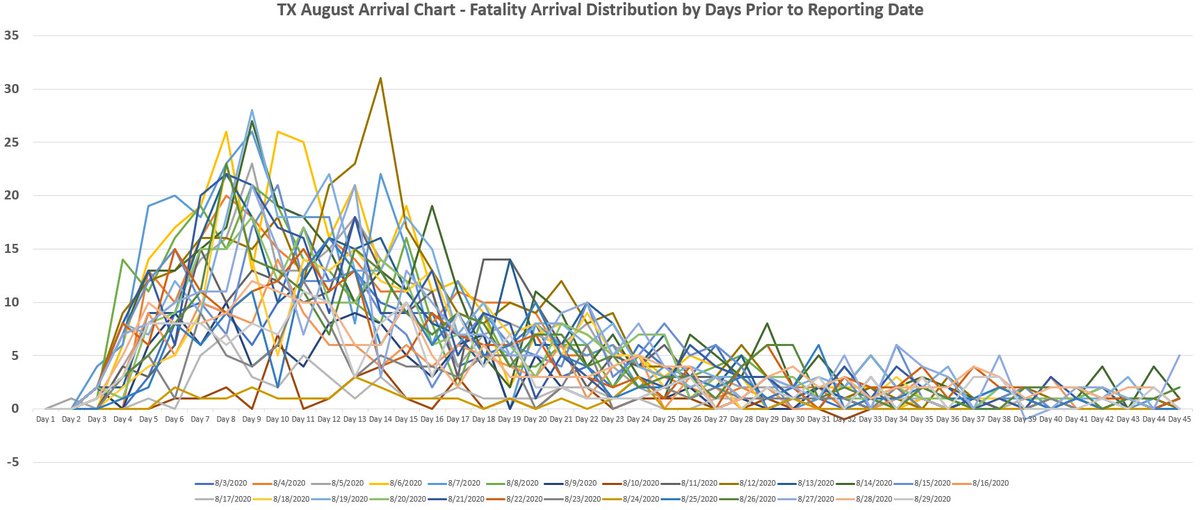
My arrival estimator projects that by Today - 3 weeks, a date will have 80% of its fatalities reported. By T-4 weeks, 90%.
Thus far the model is overestimating, I mostly revised downward this week. So I have a good handle on actuals and projected starting 3+ weeks out
4/n
Thus far the model is overestimating, I mostly revised downward this week. So I have a good handle on actuals and projected starting 3+ weeks out
4/n
Combine all that information, and you get this chart. The two summer waves, 13 months apart. Since I started projecting back to 6/20/21 this year, I am comparing 2020 starting 5/20/21.
This is cumulative fatalities starting on those dates, through Today Minus 3 weeks.
5/n
This is cumulative fatalities starting on those dates, through Today Minus 3 weeks.
5/n
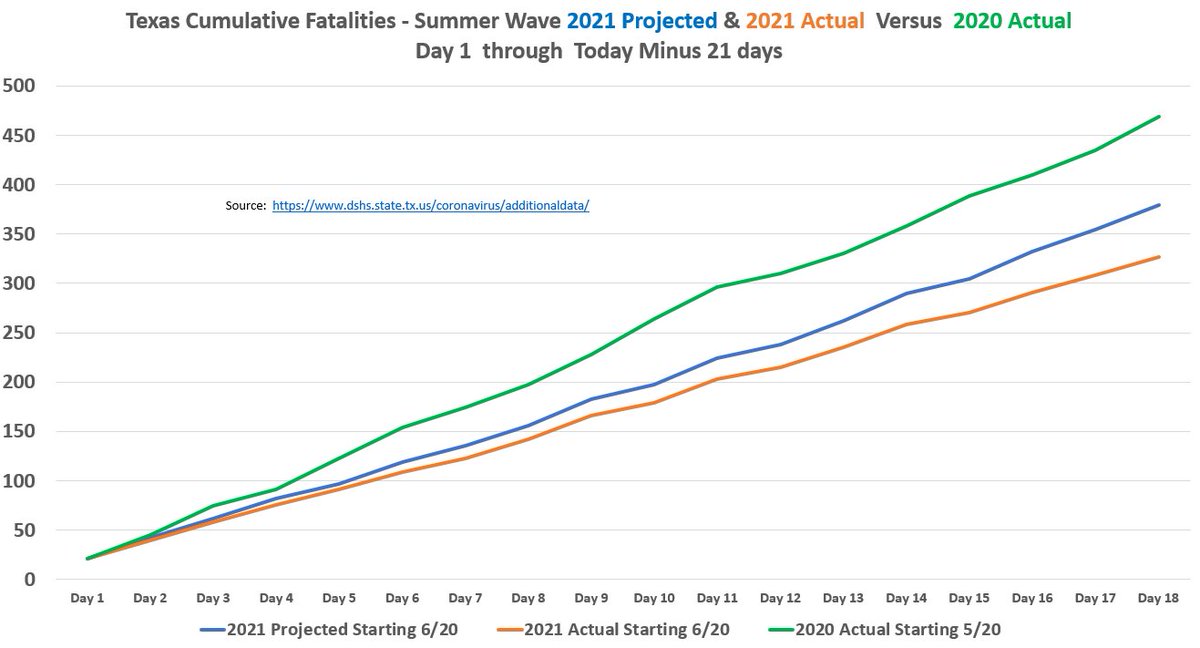
** Green line is 2020 Actuals, May 20 - June 7
** Blue line is 2021 Projections based on the estimator model, June 20 - July 8
** Orange Line is 2021 Actuals (so far) Jun 20 - Jul 8
Remember the actuals get more finalized over time. By 6 weeks 98% of the fatalities are in.
6/n
** Blue line is 2021 Projections based on the estimator model, June 20 - July 8
** Orange Line is 2021 Actuals (so far) Jun 20 - Jul 8
Remember the actuals get more finalized over time. By 6 weeks 98% of the fatalities are in.
6/n

So thus far, its preliminary, but based on 10 days of daily analysis of the fatality arrivals to the state, the modeling, and comparisons vs last years nearly identical case & hospitalization numbers, Delta SO FAR appears to have significantly fewer fatalities arriving.
7/end
7/end
8/ps
This could all change if the state were to be holding back a massive backlog of fatality reports...
But 10 daily analysis tables in, the fatality reporting is quicker than it was in August 2020. Hence why my August based model has so far had to be revised downward.
This could all change if the state were to be holding back a massive backlog of fatality reports...
But 10 daily analysis tables in, the fatality reporting is quicker than it was in August 2020. Hence why my August based model has so far had to be revised downward.
• • •
Missing some Tweet in this thread? You can try to
force a refresh


