Update on the RSI.
We closed July at 64 and are in the upward trend again.
Short 🧵👇 #Bitcoin
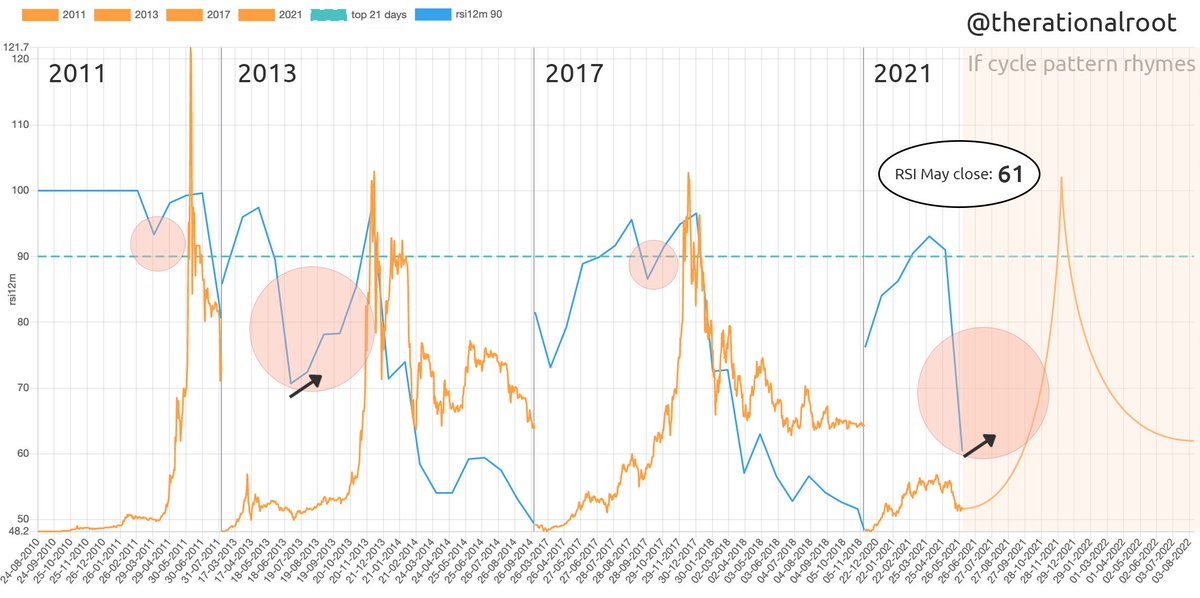
It took a month longer than in 2013 for the trend to change as this time we had 3 consecutive months in a downtrend making a low on June's close.
Like previous cycles we now have a steep recovery with July's close at 64. If history is any indicator we should go to the RSI 90's from here over the next 6 months.
Most likely we'll close higher each month from here, although we did have a flat month in 2013. Closing a month significantly lower would be worrisome.
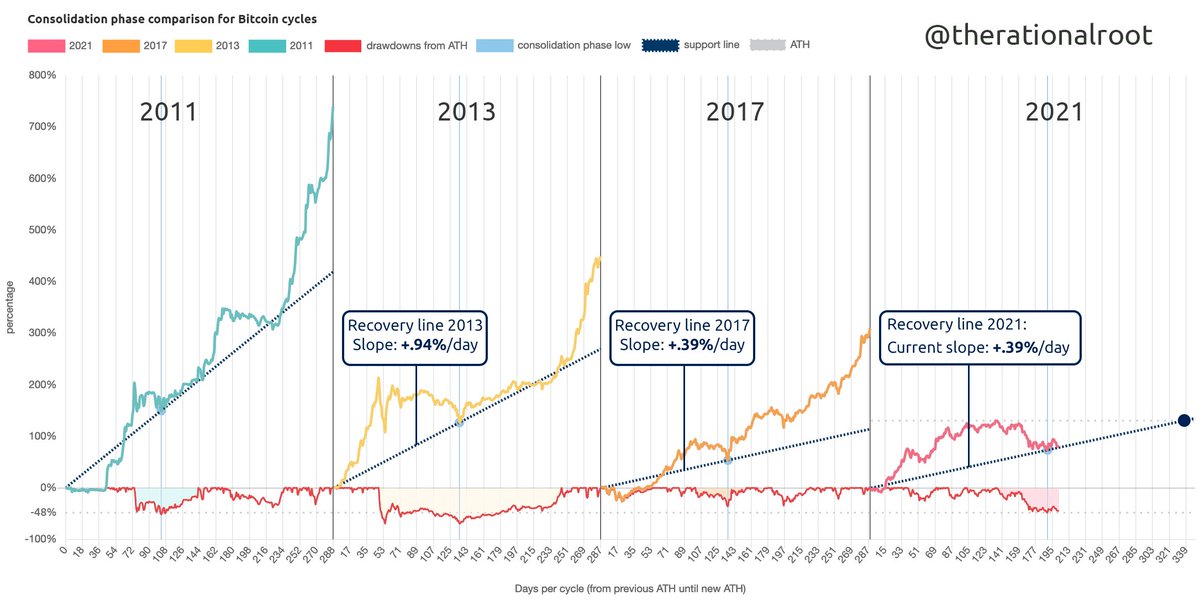
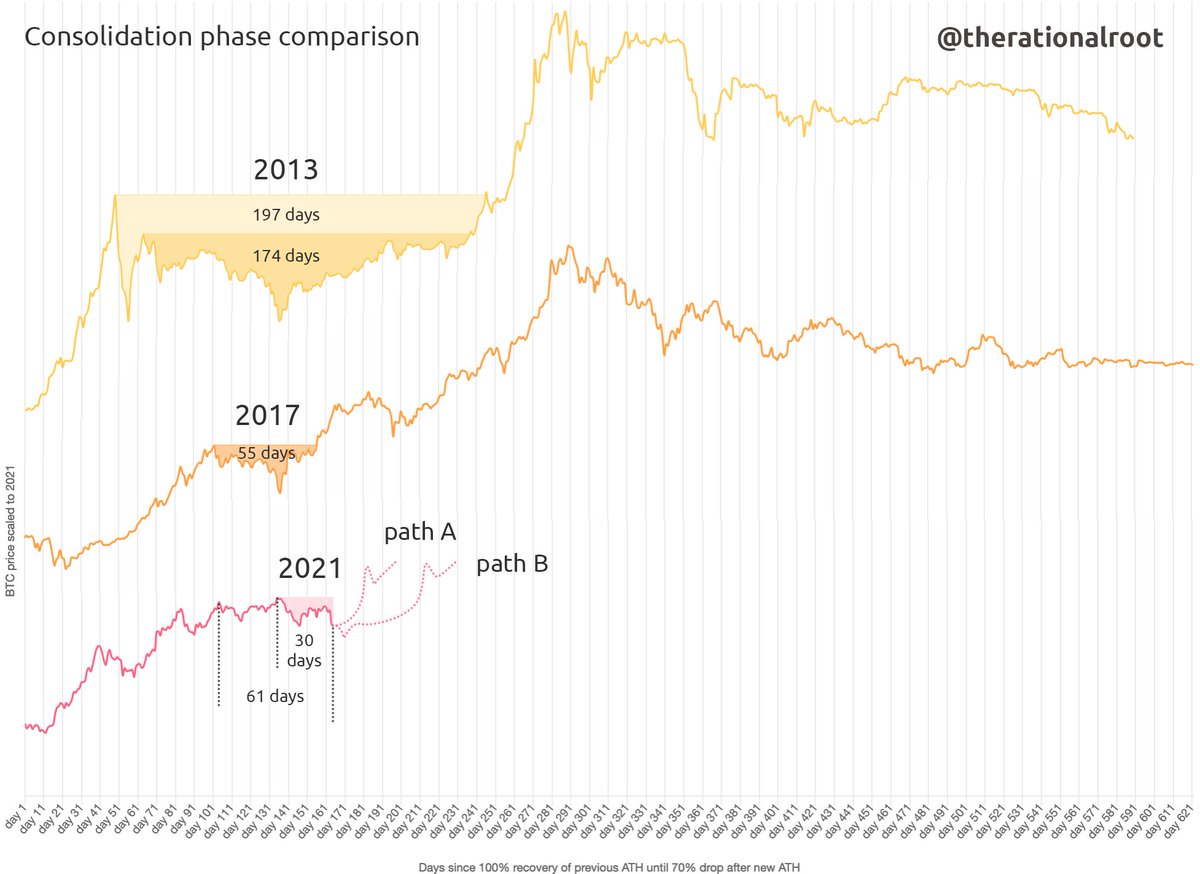
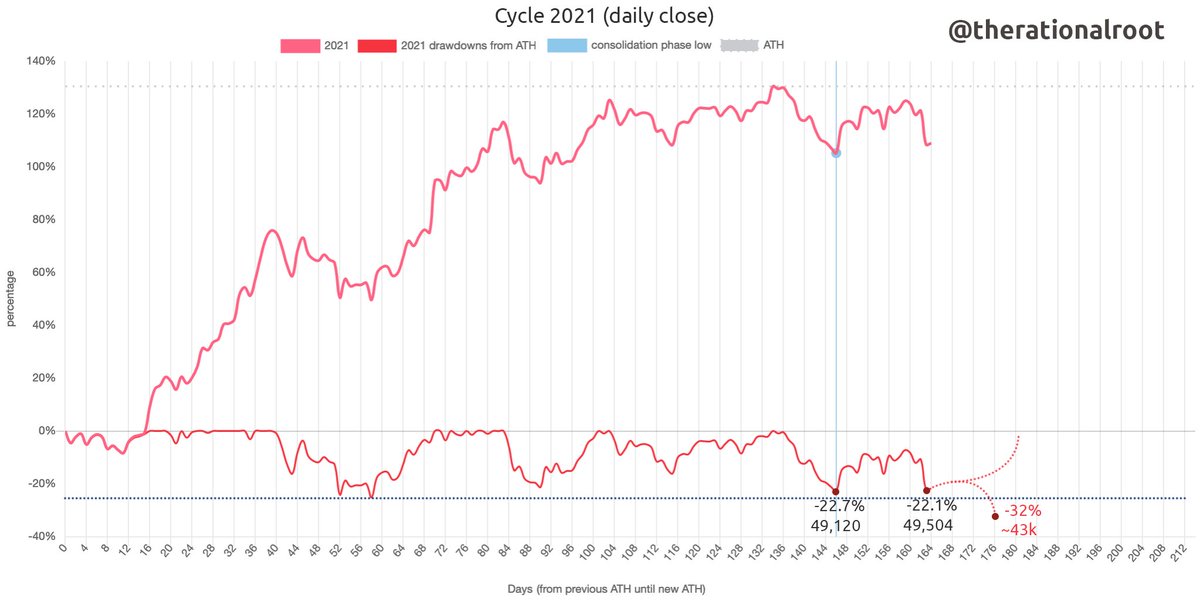
Note: the 2021 cycle in this chart is scaled to a top of 140k, instead of eg. 300k which would simulate 2017, based on a conversation with @Geertjancap. It is better to be conservative, right?
So bearish today even though we are still hovering around the same range (~35k) totally in line with previous bull markets!
🧵👇 #Bitcoin
Most on-chain indicators show we are undervalued for some time now. We can't rule out that we might go lower, although, if we do most likely it will be a spike down.
Amazing to join the conversation live with >22k bitcoiners where history is written.
Will El Salvador hold #Bitcoin on their balance:
1:
“In a couple of months the development bank [trust fund] will hold ~$150 million equivalent in #bitcoin.” - @nayibbukele
“[This is] a starter package” - @bukele
2:
Thanks @nic__carter for setting this up! You're the boss by decree!
The way the president has to go, he's rather talking to bitcoiners 🤣
Btw: The #Bitcoin bill in El Salvador has passed with 62/84 votes.
The drop below 90 was expected; however, May’s close was surprisingly low.
It’s good to mention that, if the bottom indeed is in, it fell exactly together with the monthly close bringing the RSI down further than previous cycles where the bottom was at least several days apart.
I sure expect June’s close to be an uptrend for otherwise it would be a first time to have 3 consecutive months in a downtrend which we have not seen in previous cycles and would mean uncharted territory.
Measuring from the previous ATH this cycle took 28,5% longer the reach the mid-cycle dip (assuming that the low is in). If we continue the same trend as previous cycles at this slower pace, the ATH would be on 6 Dec 2021.
If from now on we continue at the same pace as previous cycles, the ATH would be at the start of the blue area.
We are comparing each bull market by taking an aggregate of the days that we have been exploring/discovering new ATH’s aka the most bullish days of #bitcoin when FOMO is at peak levels.
Consolidation is left out since we are interested in measuring each cycle's FOMO strength.
By doing this we find a few very interesting observations:
The strength of each cycle stays remarkably consistent for the entire bull market! It follows a linear path with an uptick at the end.
We had no such uptick yet, a sign that the top is not in? 👀
Most signs point out that this cycle is a combination of 2013 and 2017. Therefore, it is likely that the duration of the consolidation phase is also in between the two. We had 174 days in 2013 and 55 in 2017. We are only 30 days in (or 61 if you count from March 13th).
Another month at the very least (even 2) would be totally normal! Initially I drew path A but maybe path B might be more likely now. This also aligns with an RSI monthly close below 90 (more on this below).
How deep can we go? I initially expected a dip to max ~43k but as low as 38k would not break market structure. 38k is unlikely as this implies > 37% drop. We didn’t get 43k in the last dip, will we now? We might but I wouldn’t count on it, we haven’t seen this kinda volatility.