One of my main contributions to the #IPCCReport was to coordinate the Frequently Asked Questions.
With @nigelhawtin @TomMaycock @connorsSL @MelichatGo and the authors, we've produced 34 1-page explainers + figure on important climate concepts.
👉
ipcc.ch/report/ar6/wg1…
With @nigelhawtin @TomMaycock @connorsSL @MelichatGo and the authors, we've produced 34 1-page explainers + figure on important climate concepts.
👉
ipcc.ch/report/ar6/wg1…

In the coming weeks, I'll try to share the main findings from the FAQs.
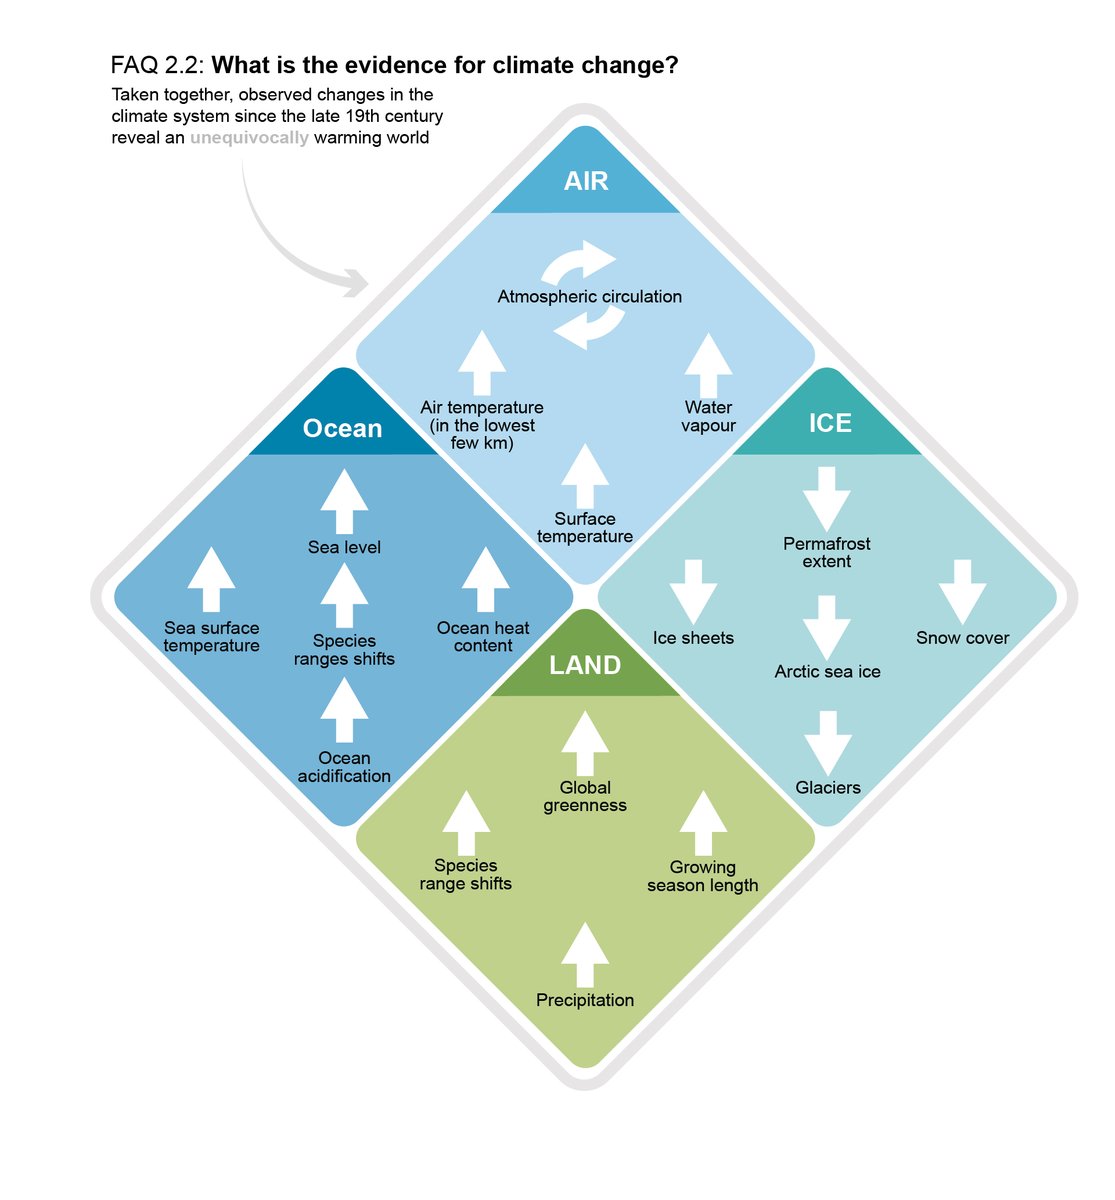
1/ for the 1st time, #ClimateReport says that human influence on the climate is an established fact. To support this, we show the many consistent lines of evidence showing that the world is warming /FAQ2.2
1/ for the 1st time, #ClimateReport says that human influence on the climate is an established fact. To support this, we show the many consistent lines of evidence showing that the world is warming /FAQ2.2

2/ from FAQ2.2, we know that the climate is changing. The observed warming since 1850 (black) can *only* be explained by human activities (grey: red + blue). Natural causes (green) have had a limited effect
PS: climate simulations are very close to observations /FAQ3.1
PS: climate simulations are very close to observations /FAQ3.1

3/ Yes the climate has changed in the past but this warming is different: it's global, rapid, it goes against a (slow) natural cooling trend and it's much warmer than the previous millennia.
(well it's also caused by humans)
/FAQ2.1 #ClimateReport
(well it's also caused by humans)
/FAQ2.1 #ClimateReport

4/ Since the 70s, more energy has reached the earth than left it (because of greenhouse gases). It is mostly the ocean that has absorbed this extra or 'excess' energy /FAQ7.1 #ClimateReport 

5/ Since the 60s, CO2 emissions have increased a lot but only ~half of that CO2 has remained in the atmophere, the rest was taken up by land and ocean. (Note that CO2 take-up is very different from excess energy take up by the ocean) /FAQ5.1 by @soenke_zaehle #ClimateReport 

6/ Cities are usually warmer than their surroundings, due to different warming factors (orange) and lack of cooling factors (green). That means that cities will be hotspots of global warming! /FAQ10.2 #ClimateReport #IPCCReport 

7/ Climate change is not uniform: some regions are more affected than others.
These patterns are proportional to the level of global warming (differences are much more pronounced at +3 ºC (compared to +1.5ºC). /FAQ4.3 #IPCCReport #ClimateReport
These patterns are proportional to the level of global warming (differences are much more pronounced at +3 ºC (compared to +1.5ºC). /FAQ4.3 #IPCCReport #ClimateReport

8/FAQ4.3 👆shows that climate change is not geophraphically uniform...
Additionally, changes in climate extremes sometimes follow changes in averages (e.g. temperature) but can also be very different (e.g. precipitation) #ClimateReport #IPCCReport /FAQ11.1
Additionally, changes in climate extremes sometimes follow changes in averages (e.g. temperature) but can also be very different (e.g. precipitation) #ClimateReport #IPCCReport /FAQ11.1

9/ Some of the future extreme climate and weather events we will experience will be unprecedented in their:
✴️magnitude
✴️frequency
✴️location
✴️timing
✴️or combination with other extremes
#ClimateReport #IPCCRReport /FAQ11.2
✴️magnitude
✴️frequency
✴️location
✴️timing
✴️or combination with other extremes
#ClimateReport #IPCCRReport /FAQ11.2

10/ ... and many of the current extreme events -- which are now more intense and probable than before -- can be attributed to human influence. #ClimateReport #IPCCReport /FAQ11.3 

11/ still on extremes - FAQ 8.3 explains the different types of #droughts and its figure 👇 highlights where droughts are expected to increase in the future. #ClimateReport #IPCCReport /FAQ8.3 

12/ now on #flooding -- A warmer climate increases the amount and intensity of rainfall during wet events. This amplifies the severity of flooding BUT the link between rainfall and flooding is rather complex! #ClimateReport #IPCCReport /FAQ8.2 

13/In the next 20 yrs, we know that current climatic trends (grey) will continue (with little difference between the emission scenarios - blue and red)
BUT we cannot predict the exact magnitude, because of natural variability...
#ClimateReport #IPCCReport /FAQ4.1
BUT we cannot predict the exact magnitude, because of natural variability...
#ClimateReport #IPCCReport /FAQ4.1

14/...#NaturalVariability (green curve) strongly influences temperature on short time scales (<20 yrs) but its effect on longer climatic trends (>30 yr) is minimal, compared to human influence (black curve)
#ClimateReport #IPCCReport /FAQ3.2
#ClimateReport #IPCCReport /FAQ3.2

15/ #SeaLevel reacts slowly to temperature changes.
Sea level of the next 20 yr will be driven by past emissions (with little influence from natural variability)
But today's choices (blue vs red) determine future sea level for 100s of years.
#ClimateReport #IPCCReport /FAQ9.2
Sea level of the next 20 yr will be driven by past emissions (with little influence from natural variability)
But today's choices (blue vs red) determine future sea level for 100s of years.
#ClimateReport #IPCCReport /FAQ9.2

16/Having slow components in the climate system (e.g. ocean thermal expansion - purple) means that some aspects of climate change are #irreversible on human-time scales (even if we remove massive amounts of CO2 from the atmosphere)
#ClimateReport #IPCCReport /FAQ5.3
#ClimateReport #IPCCReport /FAQ5.3

17/ #irreversibility is also linked so-called "feedback" mechanisms.
#IceSheets take 10,000s of yrs to grow (light blue) but but retreat much more quickly (dark blue) because of destabilisation mechanisms that intensify ice losses (bottom).
#ClimateReport #IPCCReport /FAQ9.1
#IceSheets take 10,000s of yrs to grow (light blue) but but retreat much more quickly (dark blue) because of destabilisation mechanisms that intensify ice losses (bottom).
#ClimateReport #IPCCReport /FAQ9.1

18/ Another potential climate feedback (self-reinforcing mechanism) is carbon release from #permafrost.
While the thawing of frozen grounds in the #Arctic will release carbon and amplify global warming, this won't lead to runaway warming.
#ClimateReport #IPCCReport /FAQ5.2
While the thawing of frozen grounds in the #Arctic will release carbon and amplify global warming, this won't lead to runaway warming.
#ClimateReport #IPCCReport /FAQ5.2

19/ still on climate feedbacks :
climate-cloud interactions are very complex BUT - in warmer world- #clouds are now expected to *amplify future warming*
#ClimateReport #IPCCReport /FAQ7.2
climate-cloud interactions are very complex BUT - in warmer world- #clouds are now expected to *amplify future warming*
#ClimateReport #IPCCReport /FAQ7.2

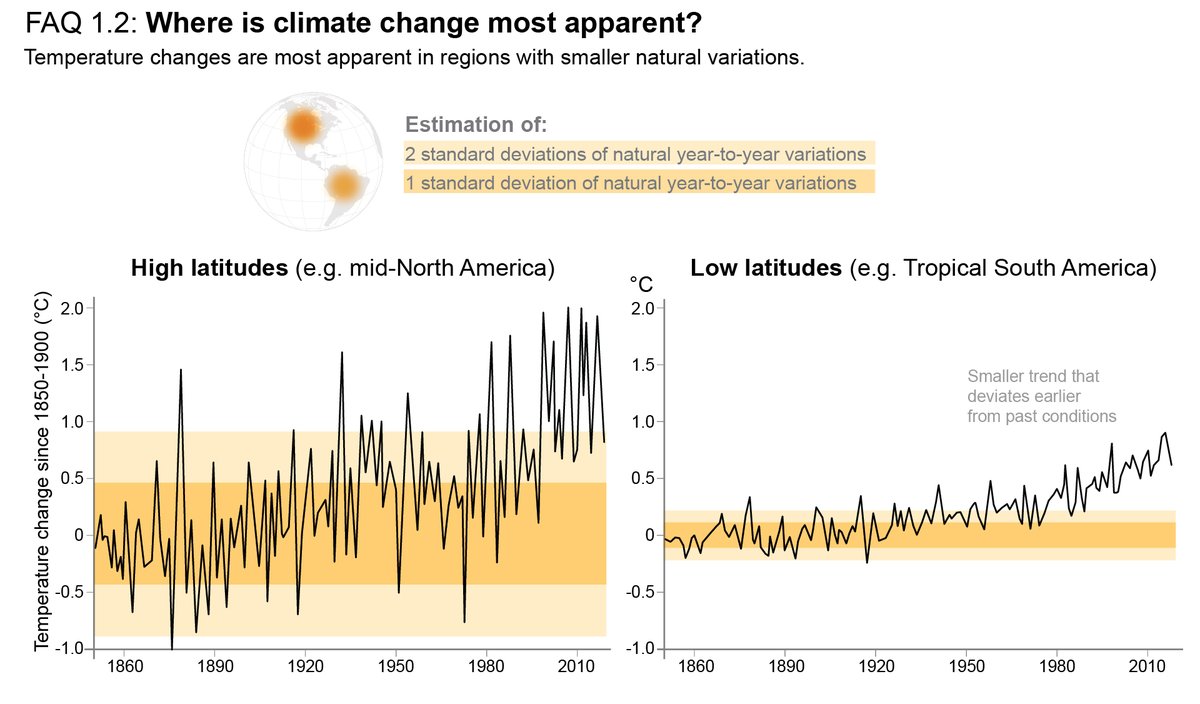
20/ Climate or temperature change is most apparent/detectable in the places with smaller natural variations (e.g. tropics) NOT in the places changing the most (e.g Arctic).
This is called #emergence of a signal.
#ClimateReport #IPCCReport /FAQ1.2
This is called #emergence of a signal.
#ClimateReport #IPCCReport /FAQ1.2

21/#emergence (FAQ1.2 👆) also works with climate action:
If we strongly reduce CO2 emissions (top, blue curve)...
...it would take 5-10 yr to detect the effect in CO2 concentration in the atmosphere...
...and 20-30 yr to detect it in the temperature
#IPCCReport /FAQ4.2
If we strongly reduce CO2 emissions (top, blue curve)...
...it would take 5-10 yr to detect the effect in CO2 concentration in the atmosphere...
...and 20-30 yr to detect it in the temperature
#IPCCReport /FAQ4.2

22/ Short-lived climate forcers (#SLCFs) are chemical compounds that affect the climate on the short-term : they stay in the atmosphere for days to years.
See the main SLCFs, their sources, lifetime and climate effect (warming - orange vs cooling -blue) 👇
#IPCCReport /FAQ6.1
See the main SLCFs, their sources, lifetime and climate effect (warming - orange vs cooling -blue) 👇
#IPCCReport /FAQ6.1

23/Many air pollutants are short-lived climate forcers.
Climate change and #AirQuality are 2 issues often treated separately but so interlinked that they would be best tackled together (to favour win-win situations = 'benefits' boxes 👇).
#IPCCReport #ClimateReport /FAQ6.2
Climate change and #AirQuality are 2 issues often treated separately but so interlinked that they would be best tackled together (to favour win-win situations = 'benefits' boxes 👇).
#IPCCReport #ClimateReport /FAQ6.2

• • •
Missing some Tweet in this thread? You can try to
force a refresh


