Happy #IndependenceDay folks !!!

Here are 5 infographics to show how the Indian Economy has fared over the last 75 years of Independence.

A thread🧵
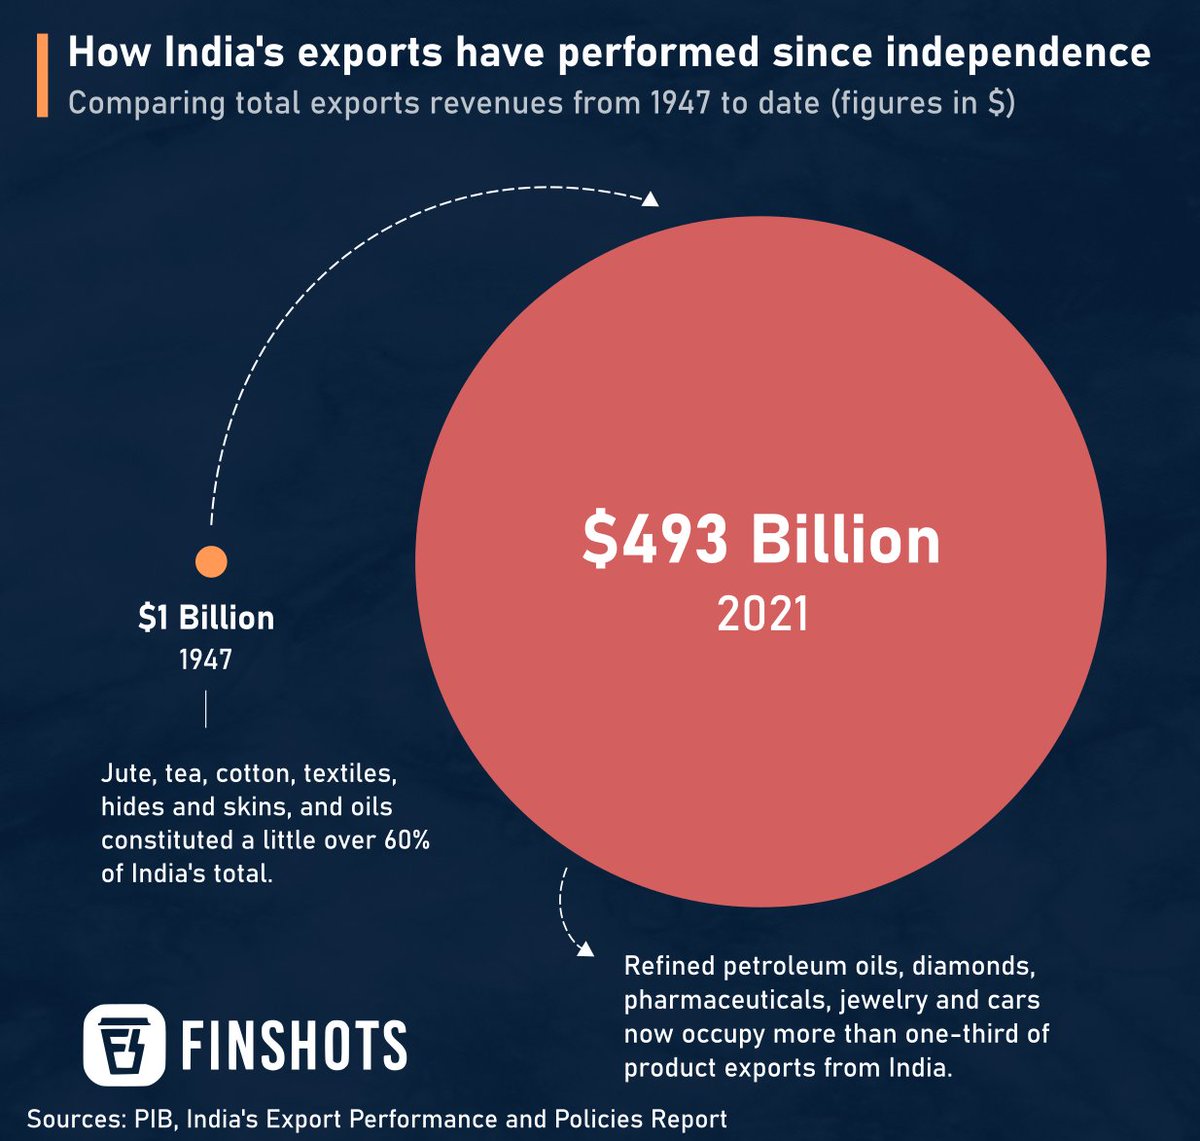
1.) The spectacular rise of Indian exports since 1947: Image
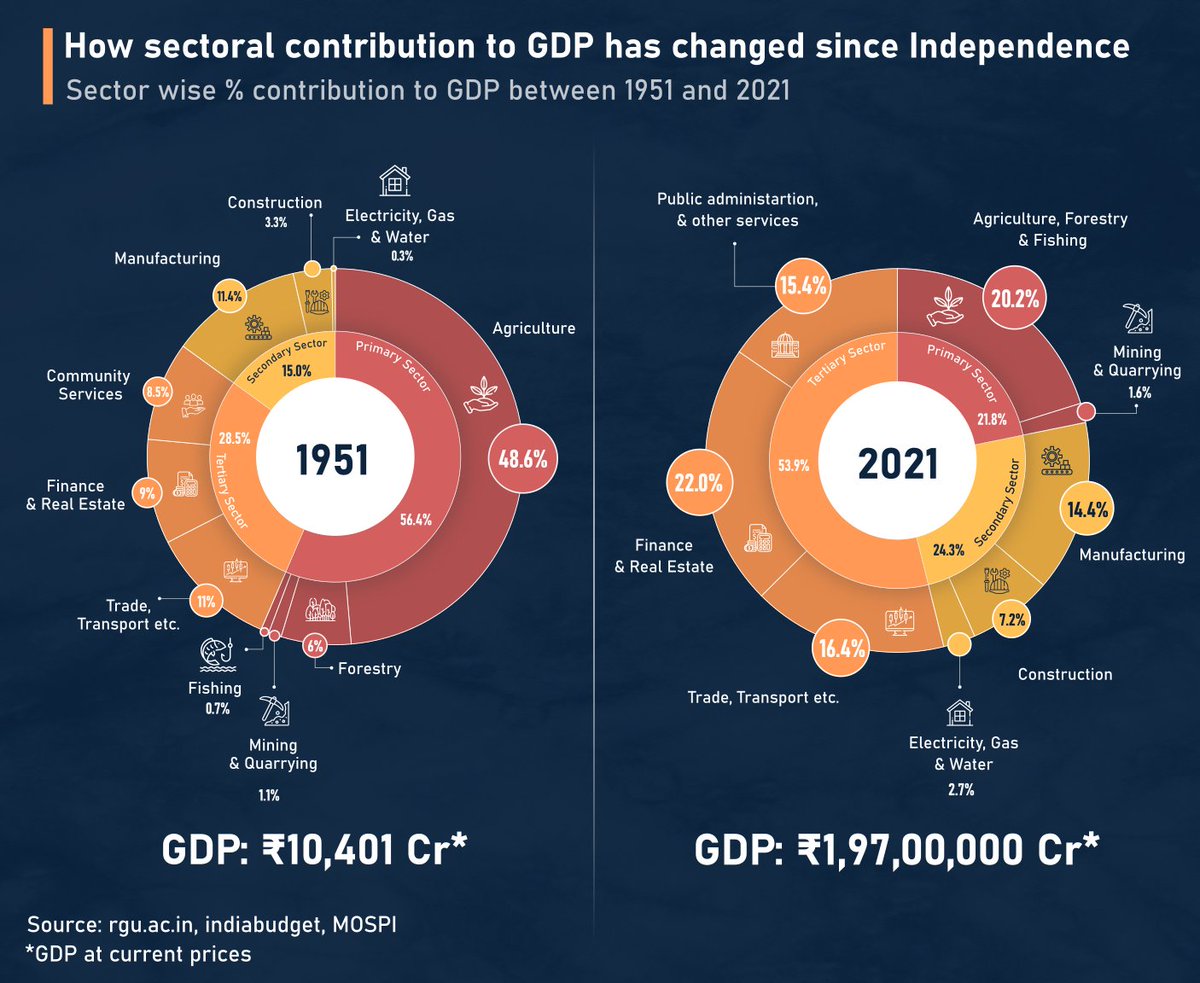
2.) How the sectoral contribution to GDP has changed over the years: Image
3.) Visualising the rise in Govt. revenues since independence: Image
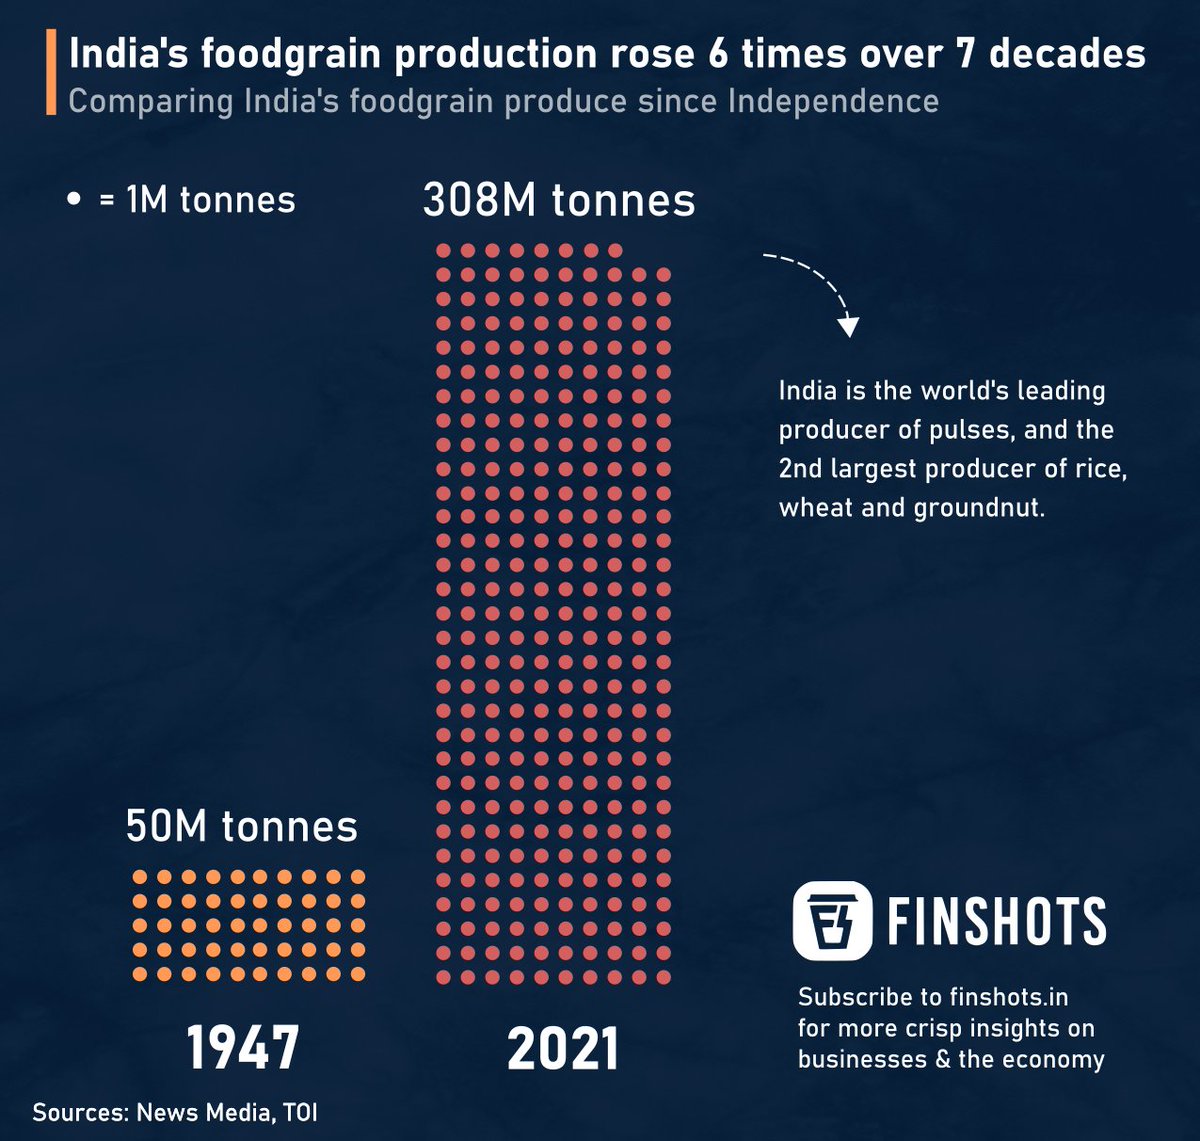
4.) India's foodgrain production has risen 6 fold in over 7 decades. Image
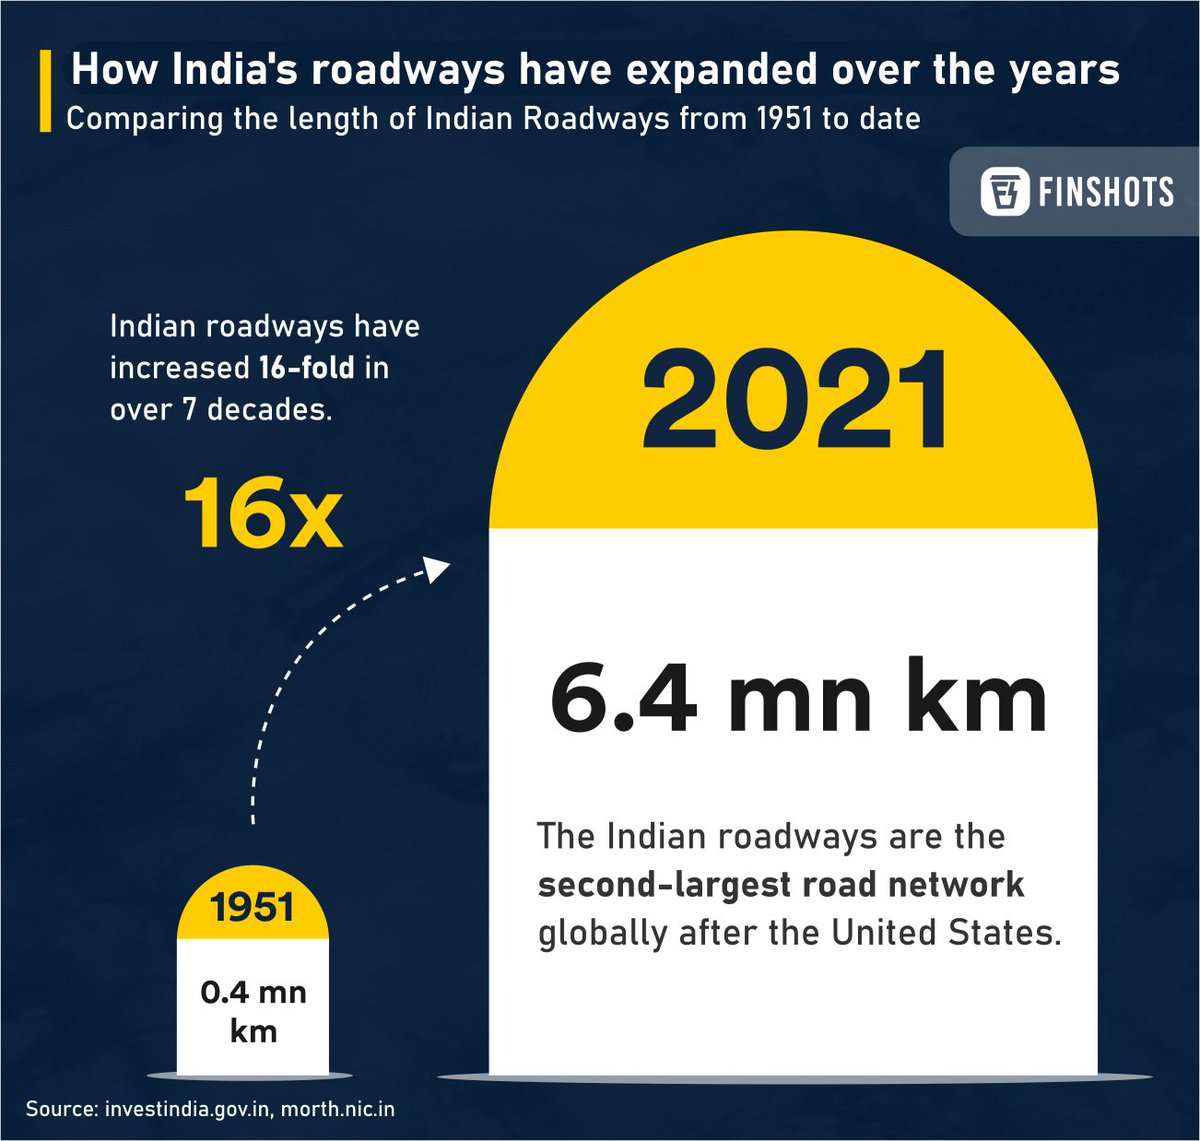
5.) The massive expansion of Indian roadways since the 1950s. Image

• • •

Missing some Tweet in this thread? You can try to force a refresh
 

Keep Current with Finshots

Finshots Profile picture

Stay in touch and get notified when new unrolls are available from this author!

Read all threads

This Thread may be Removed Anytime!

PDF

Twitter may remove this content at anytime! Save it as PDF for later use!

Try unrolling a thread yourself!

how to unroll video
  1. Follow @ThreadReaderApp to mention us!

  2. From a Twitter thread mention us with a keyword "unroll"
@threadreaderapp unroll

Practice here first or read more on our help page!

More from @finshots

16 Sep
Sri Lanka's forex reserves have dropped precipitously, from $7.5B in Nov '19 to just $2.8B in July.

And now a lot of people are worried about Sri Lanka's worsening economic crisis.

So what's the deal? 👇(1/9)
Sri Lanka’s problem seems to stem from the fact that the country is quickly running out of foreign exchange reserves — Things like gold, dollars, and other dollar-like assets.

But how did it get here? (2/9)
Well, Sri Lanka is what you call a “Frontier Economy” — it’s neither underdeveloped nor big enough to be branded an emerging economy. Countries like these are usually dependent on a few specialized sectors.
(3/9)
Read 9 tweets
14 Sep
#Google Maps has a near-monopoly in online navigational services.

Think about it- when was the last time you used any other digital mapping app?

And yet, Google offers this for free.

So, what gives?

A thread 👇(1/7)
Well, the majority of their revenue comes from advertising. When you search for a #business on Google, it lists the local businesses as map results.

Advertisers pay to have their listings featured more prominently in this map result. (2/7)
For eg, if Starbucks wants to show up at the top of search results in "coffee shops near me", it can pay Google Maps for this listing.

Google also earns income through its Google Maps Platform from companies and industries that need navigation, tracking, and mapping. (3/7)
Read 8 tweets
10 Sep
Some of the most unusual economic indicators you've probably never heard of- Part 2!

A thread👇 (1/11)
1.) The Bike Fatality Index - Evidence from the UK suggests that bike fatalities increase during recessions.

During periods of financial uncertainty, commuters avoid trains & cars in favor of bicycles.

More cyclists out on the roads raise the probability of mishaps. (2/11)
2.) Romance Novels Indicator - A bad economy can be heartbreaking. And what can be a good escape from heartbreak? A larger-than-life, cheesy romance novel! (3/11)
Read 12 tweets
7 Sep
The brilliant psychological ploy #businesses use to trick YOU into overspending.

A thread.👇
A decade ago, behavioral economist Dan Ariely noticed something strange about the subscription option of the international weekly magazine, The Economist.

The options were:
1. Web-only subscription - $59.
2. Print-only subscription - $125.
3. Web + print subscription - $125.
Dan thought what you’re thinking right now - "why would anyone buy the print-only subscription?"

On conducting a #study among MIT students, he found out that 84% chose the web and print option while only 16% of the students chose the web-only option.
Read 9 tweets
1 Sep
Ever wondered how buffet restaurants like Barbeque Nation offer unlimited food at such low prices?

A thread👇 (1/10)
Let’s start with their first offering - drinks. Soft drinks are one of the cheapest supplies for any restaurant, and these are offered in many ways - either as a complementary option or as a bottomless option where you pay for a glass but get unlimited refills. (2/10)
The idea is to make you drink them as much as possible so that you’re eating less food. (3/10)
Read 11 tweets
30 Aug
If you are a regular shopper, you might have noticed that women’s products cost more than the male equivalent or generic products.

Is this a fluke, or are #women paying more for products made for them?

Turns out, yes, women pay an invisible cost in the form of “The Pink Tax”👇
But the catch is - it’s not really a legitimate #tax imposed by the govt. It’s a cost added on products that are marketed towards women. The packaging on these products is often pink, ergo the name.
For eg, a study in the US found that the ingredients in shampoos & deodorants are almost identical for men & women, but prices for female-targeted items were nearly twice as much. Reports suggest that this pink tax costs women $2135 a year.
Read 7 tweets

Did Thread Reader help you today?

Support us! We are indie developers!


This site is made by just two indie developers on a laptop doing marketing, support and development! Read more about the story.

Become a Premium Member ($3/month or $30/year) and get exclusive features!

Become Premium

Too expensive? Make a small donation by buying us coffee ($5) or help with server cost ($10)

Donate via Paypal Become our Patreon

Thank you for your support!

Follow Us on Twitter!

:(