so my ideas for tomorrow
- DisablePagingExecutive
- LowMemoryThreshold = 256 mb
after testing those options individually in hopes of making remote shutdown more responsive, continue testing lower values of Max Server Memory, looking for test completion w/o error.
- DisablePagingExecutive
- LowMemoryThreshold = 256 mb
after testing those options individually in hopes of making remote shutdown more responsive, continue testing lower values of Max Server Memory, looking for test completion w/o error.
i've been batting this problem around for *four* years now. time to make some serious headway.
comes a time when "just keep setting [Max Server Memory] lower if the vm becomes unresponsive" is no longer a palatable strategy.
i can tell it's still making progress on the shutdown.
it's just taking *forever*
RDP connections fail one step closer to completing now.
it's just taking *forever*
RDP connections fail one step closer to completing now.

twenty-twenty-twenty four hours and mo-o-re
i'm gettin' real frustrated*
*nahhh, just finally gonna ask my colleague to reset the vm. i decided a while back 24 hours was time to abandon and get to testin' DisablePagingExecutive and LowMemoryThreshold.
i'm gettin' real frustrated*
*nahhh, just finally gonna ask my colleague to reset the vm. i decided a while back 24 hours was time to abandon and get to testin' DisablePagingExecutive and LowMemoryThreshold.

DisablePagingExecutive test comes first. unless there is a strong reason otherwise, i like to test a simple on/off before getting to a "tunable" like LowMemoryThreshold.
[Max Server Memory] is set to 55GB on this vm with 64GB vRAM. So when it is time to test LowMemoryThreshold i'll start at 1.5 GB. (HighMemoryThreshold then becomes triple that - 4.5 GB). that's too high for a prod scenario on this rig but it should make an effect clear.
i am at the 15 minute mark of a test with DisablePagingExecutive set to 1 in the Windows registry (and a reboot following set to make it active).
entering the danger zone.
entering the danger zone.

i have to say "entering the danger zone", ok?
this is as James Bond as it gets for me 😂😂😂
this is as James Bond as it gets for me 😂😂😂
Code blue! Code blue!
Enact extreme observability protocols!!
Enact extreme observability protocols!!
![SSMS query window showing [Target Server Memory] at 563200](https://pbs.twimg.com/media/E9AxiCNXsAUH4AK.png)
uh oh.

i've still got a sqlcmd connection though.
it's currently hanging with a DMV query.
it's currently hanging with a DMV query.

and ping is timing out.
well. it last longer than without that registry setting. a little bit.
the remote shutdown command returned almost immediately.
the remote shutdown command returned almost immediately.
but rdp is still encountering an internal error when trying to make contact.
ping is still timing out.
Response to another remote shutdown command is:
A system shutdown is in progress.(1115)
so that's a good thing. (rather than messages about an unrecognized interface, or failure to contact the system)
A system shutdown is in progress.(1115)
so that's a good thing. (rather than messages about an unrecognized interface, or failure to contact the system)
and the vm is back up.
so. i didn't get all that i had hoped. but it is a bit more responsive to remote shutdown commands. On to seeing what a larger LowMemoryThreshold looks like.
so. i didn't get all that i had hoped. but it is a bit more responsive to remote shutdown commands. On to seeing what a larger LowMemoryThreshold looks like.
ok let's go

back in the danger zone.
what's it gonna be?
what's it gonna be?

heh-heh.
nice.
nice.

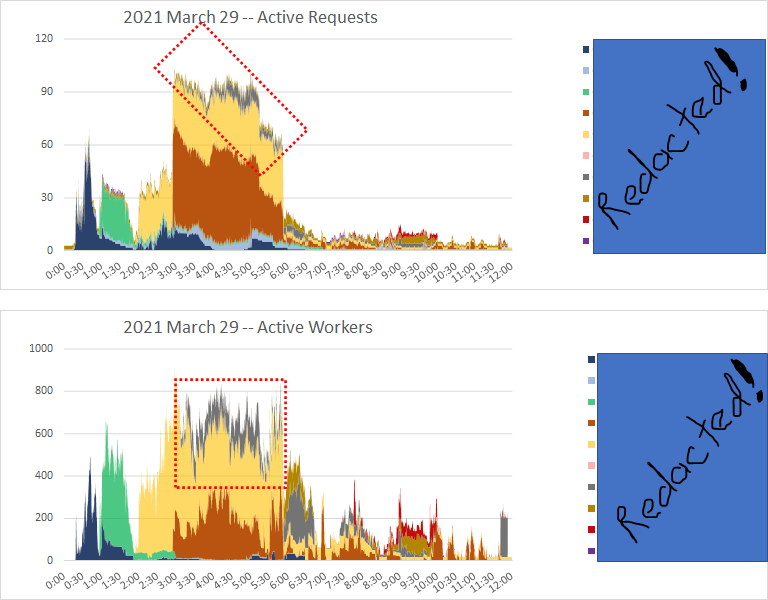
too early to celebrate, though. i recognize this part of these queries (4 concurrent executions of the same query, all started within memoents of each other.)
the worst is yet to come.
the worst is yet to come.

hm. timeout from SSMS.

dang it. new sqlcmd connection timed out.
no response to ping.
no response to ping.
remote shutdown command issued two minutes ago. has not returned yet.
nothing left in my toolbelt, for now.
nothing left in my toolbelt, for now.
neither registry setting moved the needle enough to keep them in place. when the vm comes back up, i take them out, reboot, then start testing again to find the highest [max server memory] setting below the current value at which this condition does not occur.
there's a whole lot of curious behavior during such extreme memory crises.
but i've seen enough of it for now. from now on, if shutdown doesn't complete in 10 minutes, time to reset the vm.
but i've seen enough of it for now. from now on, if shutdown doesn't complete in 10 minutes, time to reset the vm.
i am really surprised by the lack of benefit to increasing LowMemoryThreshold. i'll hafta look at the logs closely later.
perhaps pagefile use & #sqlserver cache-trimming (other than bpool) started earlier than otherwise, but stubborn refusal to shrink awe-bpool sunk it anyway.
perhaps pagefile use & #sqlserver cache-trimming (other than bpool) started earlier than otherwise, but stubborn refusal to shrink awe-bpool sunk it anyway.
this sends me for a loop every time i see it.
is system memory high? yes.
is system memory low? somehow, also yes.
is system memory high? yes.
is system memory low? somehow, also yes.

hang with me for a little bit for today's episode of DBCC MEMORYSTATUS math ain't mathin'
vm committed is pageable, not necessarily paged.
locked pages allocated are via awe, not pageable.
in this case, includes large pages.
vm committed is pageable, not necessarily paged.
locked pages allocated are via awe, not pageable.
in this case, includes large pages.

65146784 kb Locked pages allocated
+ 800292 kb VM committed
--
65947076 kb
65947080 kb Current committed in MEMORYSTATUS results. Let's call that even. Good. What's a single 4kb page among friends?
+ 800292 kb VM committed
--
65947076 kb
65947080 kb Current committed in MEMORYSTATUS results. Let's call that even. Good. What's a single 4kb page among friends?

Memory Manager said 65146784 kb locked pages.
SQLOS node 0 said 65146760 kb locked pages.
i'll let it slide. (the numbers are reported with timestamps a few seconds apart, anyway)
SQLOS node 0 said 65146760 kb locked pages.
i'll let it slide. (the numbers are reported with timestamps a few seconds apart, anyway)

MEMORYSTATUS results for MEMORYCLERK_SQLBUFFERPOOL node 0 show 1295748 kb locked pages allocated. Huh.
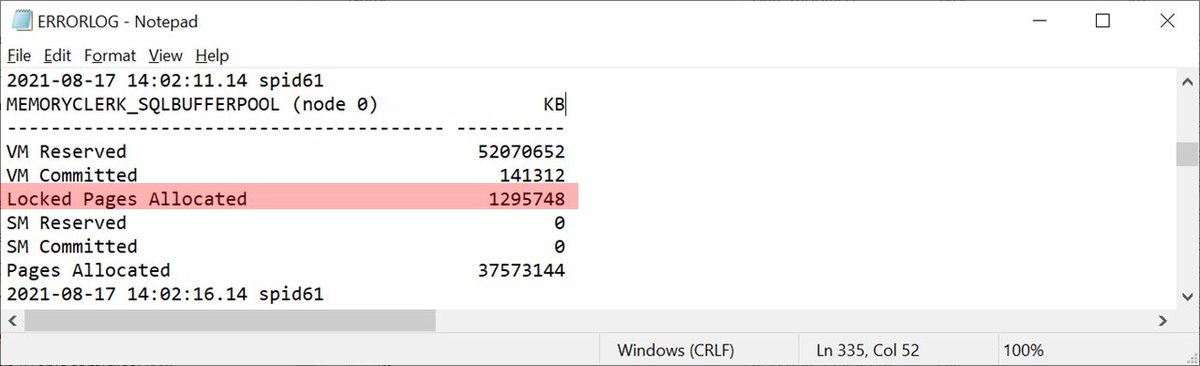
65146760 kb locked pages, n0 total
- 1295748 kb locked pages, n0 sqlbufferpool
--
63851012 kb locked pages, n0 other (?)
- 1295748 kb locked pages, n0 sqlbufferpool
--
63851012 kb locked pages, n0 other (?)
this is the math that ain't mathin'
there is no way for it to work out.
there is no way for it to work out.
https://twitter.com/sqL_handLe/status/1427724599064678408
There is simply no way for their to be 63851012 kb locked pages in node 0 that are NOT in the database cache buffer pool, given the 37573144 kb of node 0 buffer pool pages allocated.
the sum of those two is 101424156 kb, or ~96.7 gb.
the sum of those two is 101424156 kb, or ~96.7 gb.

The vm has 64 gb of vRAM. Lets pretend it *all* as consumed by #sqlserver.
There's a single pagefile on the C drive, starting at 4GB in size. There's 36.5 gb free on the C drive. If the pagefile consumed all free space on the drive it'd be 40.5 gb in size.
There's a single pagefile on the C drive, starting at 4GB in size. There's 36.5 gb free on the C drive. If the pagefile consumed all free space on the drive it'd be 40.5 gb in size.
"Aha!" Says the one always trying to catch me slippin' in maths.
"~64 gb vRAM + 40.5 gb potential pagefile is 104.5 gb potential total virtual memory! And only had to get to 96.7 gb!!
Take that, ya wanker!"
"~64 gb vRAM + 40.5 gb potential pagefile is 104.5 gb potential total virtual memory! And only had to get to 96.7 gb!!
Take that, ya wanker!"
Well, now, Ralph Malph. Simmer down.
We're playing by extreme observability rules, now.
Let's assume the paging file did reach its maximum size of 36.5 gb. Less than 10% of it was used, though.
~64 gb vRAM + 3.65 gb pagefile gives 67.65 gb as an upper bound. Way short of 96.7 gb.
We're playing by extreme observability rules, now.
Let's assume the paging file did reach its maximum size of 36.5 gb. Less than 10% of it was used, though.
~64 gb vRAM + 3.65 gb pagefile gives 67.65 gb as an upper bound. Way short of 96.7 gb.

<sad_trombone.mp3>
Like i said. The math ain't mathin'
Like i said. The math ain't mathin'
All in all, its an inconvenient time for MEMORYSTATUS not to be giving good numbers.
i was also capturing my own memorystatus results, or at least attempting too, every 5 minutes. maybe i can find a 5 minute range where things stopped making sense.
unnnnnnfortunately, under extreme memory pressure requesting a scheduled job ever 5 minutes doesn;t mean you'll get it. That 2:21 pm MEMORYSTATUS was after the vm remote restart.

But let's take a look at these MEMORYSTATUS results from 13:57:29. The FAIL_RESERVED_PAGE_ALLOCATION error occurred at 14:00:30, just 3 minutes later.
Here we see system memory high. Only. Not both high and low :-)
Here we see system memory high. Only. Not both high and low :-)

Now wait just a minute.
i think i recognize that number 1295748.
Not just from the other MEMORYSTATUS results...
i think i recognize that number 1295748.
Not just from the other MEMORYSTATUS results...

nah. i don't recognize that number.
i removed the LowMemoryThreshold registry setting, and set DisablePagingExecutive back to 0. Lowered #sqlserver [Max Server Memory] to 54000 mb. This is the calm before the storm.

in the thick of it...
i may have missed the window for a successful remote shutdown and restart...

holy camole my second attempt at remote shutdown and restart returned after just 10 seconds.
Let's see if the vm is actually coming back up...
Let's see if the vm is actually coming back up...
ping is still timing out. it's gonna be a few minutes.
it's back, not bad, not bad. lower [Max Server Memory] to 53000 mb.
remote shutdown attempted at 10:56 pm.
remote shutdown returns at 10:57 pm.
still unresponsive to ping at 11:00 pm.
a remote shutdown is in progress, y'say?
well, get on with it!
still unresponsive to ping at 11:00 pm.
a remote shutdown is in progress, y'say?
well, get on with it!

When the vm comes back, i'll lower MSM from 53000 mb to 49152 mb (48 gb).
if 4 concurrent queries can make a vm with 64 gb vRAM and MSM = 48 gb unresponsive, i'll have accomplished 100% of what i originally intended to do.
in one sense, everything's gravy after that.
if 4 concurrent queries can make a vm with 64 gb vRAM and MSM = 48 gb unresponsive, i'll have accomplished 100% of what i originally intended to do.
in one sense, everything's gravy after that.
that's the sense where everything i learn after that point is gravy.
but there still needs to be a fix or remedy, to mitigate the problems this causes.
but there still needs to be a fix or remedy, to mitigate the problems this causes.
i was contacted this week about another site with large SSAS MDM cubes processing queries going BMoR. They push the vm to using enough paging file that connection errors occur, causing havoc. The vm doesn't become unresponsive. But the errors disrupt business-necessary work.
Calm before the storm, MSM = 48 gb (49152 mb).

#sqlserver [Total Server Memory] go brrrrrrr....

*somehow* it came back after that! i think the queries are going to complete. this vm must have teetered really close to the edge.

ohhh... look at that. one of the 4 memory grants has made some significant post-initial-grant requests.

ok, this is important. with MSM set to 49152 mb, the vm did not become unresponsive. That doesn't mean memory management was hunky-dory, just that the most egregious risk was not realized. if we look in the #sqlserver error log while MSM = 49152...

For a system spid to error out with FAIL_PAGE_ALLOCATION is not a good thing. So i still want to find the threshold for unresponsive vm. but also want to see if there is a value at which no OOMs with this workload, either.
So there are two #sqlserver 2019 MSM thresholds i’m looking for with these 4 concurrent queries, this dataset, and this 8 vcpu 64 gb vRAM:
- below which no OOMs
- below which vm remains responsive
- below which no OOMs
- below which vm remains responsive
my contention is that there is no reasonable “always safe” MSM value on this system. Although i’ve not reproduced it myself, I’ve seen in the wild a single parallel batch mode columnstore query produce an unresponsive vm.
after i’m done with BMoR, time to get back to testing high concurrency checkdb with physical_only on a database with several large columnstore tables. i was able to produce this condition in that scenario a few years ago.
oh. here’s some of that high DOP checkdb with physical_only in a database with big ol’ columnstore tables fun. fun, fun, fun.
https://twitter.com/sql_handle/status/1169799088436580353
Two years later i suddenly wonder if the difference between these two checkdb executions on the same system with the same “data” was a much higher rowgroup count on August 23 (when the vm became unresponsive).
i can’t be sure but this is about the same time @JoeObbish and i were looking at a condition with trace flags 876, 11064 and 11068 that super-inflated the number of rowgroups for columnstore bulk inserts.
hm. my test yesterday with MSM = 49152 mb was flawed. In my other tests, i reboot the vm then launch the test workload. Fresh start for vm vRAM, fresh start for #sqlserver.
i didn't do that at MSM = 49152 mb.
can tell bc ideal memory for the grants was under 200 gb, not 327 gb.
i didn't do that at MSM = 49152 mb.
can tell bc ideal memory for the grants was under 200 gb, not 327 gb.
since it was second execution for these queries after startup, memory grant feedback kicked in. Ideal memory was lowered from ~327 gb to <200 gb. Still way over max grant per query which was under 8 gb at the time.
so i'll repeat the test at MSM = 49152 mb.
(after my test at MSM = 51400 mb)
if i follow my own doggone rules, might still get an unresponsive vm at 49152 mb.
(after my test at MSM = 51400 mb)
if i follow my own doggone rules, might still get an unresponsive vm at 49152 mb.
calm before the storm, MSM = 51400 mb

danger zone, MSM = 51400 mb
![SSMS query window showing [Target Server Memory (KB)] -- 52](https://pbs.twimg.com/media/E9FzpIwWEAI7cM2.jpg)
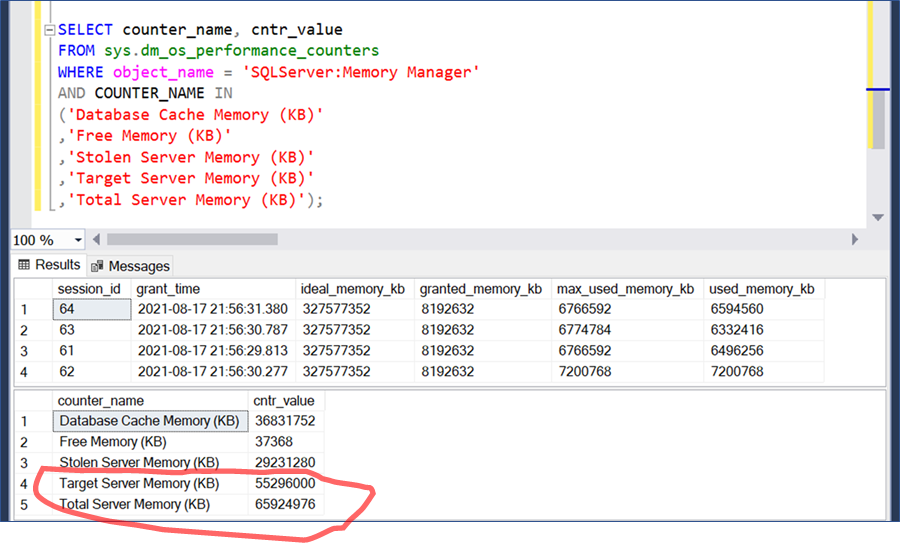
wow. #sqlserver recovered, brought [Total Server Memory] back down to [Target Server Memory]. That's what *should* happen. Might still be OOMs in the errorlog, though.
![[Target Server Memory (KB)] -- 52633600 [Total Server Memory](https://pbs.twimg.com/media/E9F0jlHXIAQfu-x.jpg)
ok here's something fun that i read about in the documentation but couldn't quite imagine till i saw it.
all 4 queries are the same, so they have the same ideal memory of ~327 gb. Default workload group has max grant per query of 20%. These 4 max out; they get grants of ~7.8 gb.
all 4 queries are the same, so they have the same ideal memory of ~327 gb. Default workload group has max grant per query of 20%. These 4 max out; they get grants of ~7.8 gb.

but... wait. sure, it says they *requested* 7792480 kb.
And each of the four say they were *granted* more than that?
And each of the four say they were *granted* more than that?

yup. these 4 sessions initially got the maximum memory grant for their workload group for these BMoR queries. As they approached using the whole grant, they began requesting additional grants. That's how they were granted more than requested.
https://twitter.com/sqL_handLe/status/1428054799933640705
With columnstore bulk insert queries, i've seen similar behavior: request a certain amount of memory grant, get that amount of grant, and during execution request more. Especially when using T876+T11064+T11068 (i do not recommend this combo).
there's an important difference, though. Columnstore bulk inserts ime don't get additional grant memory after they've hit the max grant for their workload group. In fact, if they request additional grant after they reach max grant, they terminate with a wordy error.
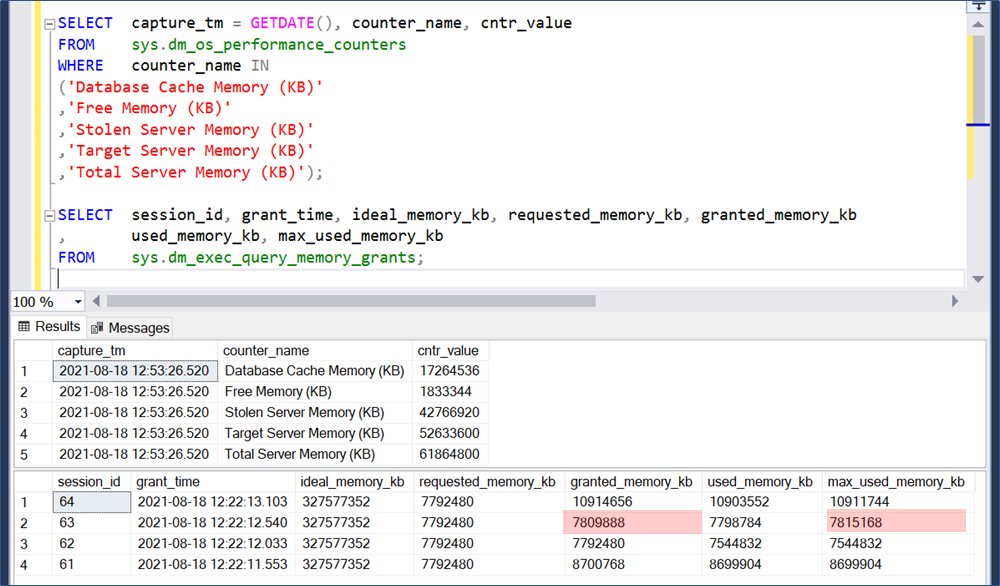
ok, last thing about these particular observation query results. notice session 63 max_used_memory_kb 7815188 is larger than granted_memory_kb 7809888.
yup. that's just a thing. used_memory_kb can be reported by dm_exec_query_memory_grants as larger than granted_memory_kb, too.
yup. that's just a thing. used_memory_kb can be reported by dm_exec_query_memory_grants as larger than granted_memory_kb, too.
pretty sure i've seen the difference beteen max_used_memory_kb & granted_memory_kb exceed a gb. sometimes granted_memory_kb increases, but doesn't catch up to used_memory_kb and/or max_used_memory_kb. ok, whatever. now that i know about that... it's not on my list for follow-up.
maybe i can pull that one off the parking lot after sewing up about 10 of these other things.
excuse me, dbcc memorystatus...
WHAT?!
WHAT?!

ohhhh. i think i uncovered another piece.
at its heart, this whole thing isn't too complex. an 8 vcpu, 64 gb vRAM vm. #SQLServer 2019. a 1.6 billion row rowstore table with a clustered index and a nonclustered index. a query that self-joins and aggregates that table - running in 4 concurrent sessions.
but there are so many moving pieces.
and the number of unreliable results from so many different probes adds to the challenge.
Like the fact that batch mode hash join tempdb spill is invisible in dm_exec_query_stats, and perfmon.
Like unreliable numbers from memorystatus.
and the number of unreliable results from so many different probes adds to the challenge.
Like the fact that batch mode hash join tempdb spill is invisible in dm_exec_query_stats, and perfmon.
Like unreliable numbers from memorystatus.
Like memory dumps that can't complete during a severe memory crisis.
Like remote shutdowns that can't even complete during a severe memory crisis.
Like remote shutdowns that can't even complete during a severe memory crisis.
but when i stare at all the moving parts, and all my graphs, and all the error information long enough... i just might get an idea.
that's what happened yesterday with registry settings LowMemoryThreshold and DisablePagingExecutive.
ok, bad example. those were dead ends.
that's what happened yesterday with registry settings LowMemoryThreshold and DisablePagingExecutive.
ok, bad example. those were dead ends.
Ok. the known rulebreakers.
First is [Total Server Memory (KB)] grossly exceeding [Target Server Memory (KB)]. Ok.
Next is #sqlserver's expected response to memory crisis being here extremely... lazy? passive? Just not bringing [Total Server Memory (KB)] down as expected. Ok.
First is [Total Server Memory (KB)] grossly exceeding [Target Server Memory (KB)]. Ok.
Next is #sqlserver's expected response to memory crisis being here extremely... lazy? passive? Just not bringing [Total Server Memory (KB)] down as expected. Ok.
BMoR queries requesting and getting additional memory grant after initially getting max grant for their workload group. Maybe not a "rulebreaker" but its outside typical behavior. Ok.
Here's another rulebreaker.
i'm used to queries terminating as a result of OOMs.
session_id 62 and 63 are two of my BMoR test queries -- apparently triggering multiple OOMs each.
i'm used to queries terminating as a result of OOMs.
session_id 62 and 63 are two of my BMoR test queries -- apparently triggering multiple OOMs each.


Individual queries that can sustain multiple OOMs without terminating, and complete without error. That's weird. Ok.
So... what if those OOMs are responses to the "additional memory grant requests" beyond the max memory grant already initially recieved.
Not the response to *every* such request. Just *some* of them.
Not the response to *every* such request. Just *some* of them.
We're already in pretty uncharted water once talking about queries getting more memory grant than the max per query in their workload group.
What if these additional grant requests are wrapped in such a way that the OOM just pops out of the request... and *re-submits*?
What if these additional grant requests are wrapped in such a way that the OOM just pops out of the request... and *re-submits*?
eventually with my 4 concurrent queries either the vm becomes unresponsive *or* one of the queries completes. Once one query completes the other 3 have an easier time maneuvering. Once a second query completes, its a walk in the park for the remaining two queries.
it's a better theory than i've had for a while.
it explains all of the pieces to the extent i know and understand them.
it explains all of the pieces to the extent i know and understand them.
Time to pack it up and send it off to folks can tell me how close i got 🤣
if my theory is correct, there is no lower MSM value which will be free from OOMs.
Oh! Time to revisit an old test.
Which might not stand up to my current level of scrutiny.
Way back when, with MSM at 56988 mb on this system, 3 concurrent queries immediately after startup with 20% max grant would render an unresponsive vm.
Which might not stand up to my current level of scrutiny.
Way back when, with MSM at 56988 mb on this system, 3 concurrent queries immediately after startup with 20% max grant would render an unresponsive vm.
But if i increased the max grant to 25%, the 3 concurrent queries would complete and the vm would stay responsive. hm.
oh. when i added my monitoring session - and started it just before the 4 test queries - i also increased the spacing between each session start from 20 ms to 120 ms.
i think this had the unintended result of slightly reducing synchronization among sessions…
i think this had the unintended result of slightly reducing synchronization among sessions…
and i think this becomes important at the time that additional grant requests start being made.
in some of my earlier tests i would see OOMs from 3 or even 4 sessions in rapid sequence in the error log.
Now there’s typically only 1, maybe 2.
Now there’s typically only 1, maybe 2.
• • •
Missing some Tweet in this thread? You can try to
force a refresh