New findings on spending during unemployment and macro conditions by my colleagues at #JPMCInstitute

TLDR: UI policy and liquidity are the key drivers of spending for unemployed households.

Macro conditions, in contrast, appear not to matter.

Thread
^ Spending very similar for
* Green line: Great Recession
* Blue line (almost identical): 2010's boom

These are two periods where macro conditions are very different, but income in the first few months of unemployment are very similar
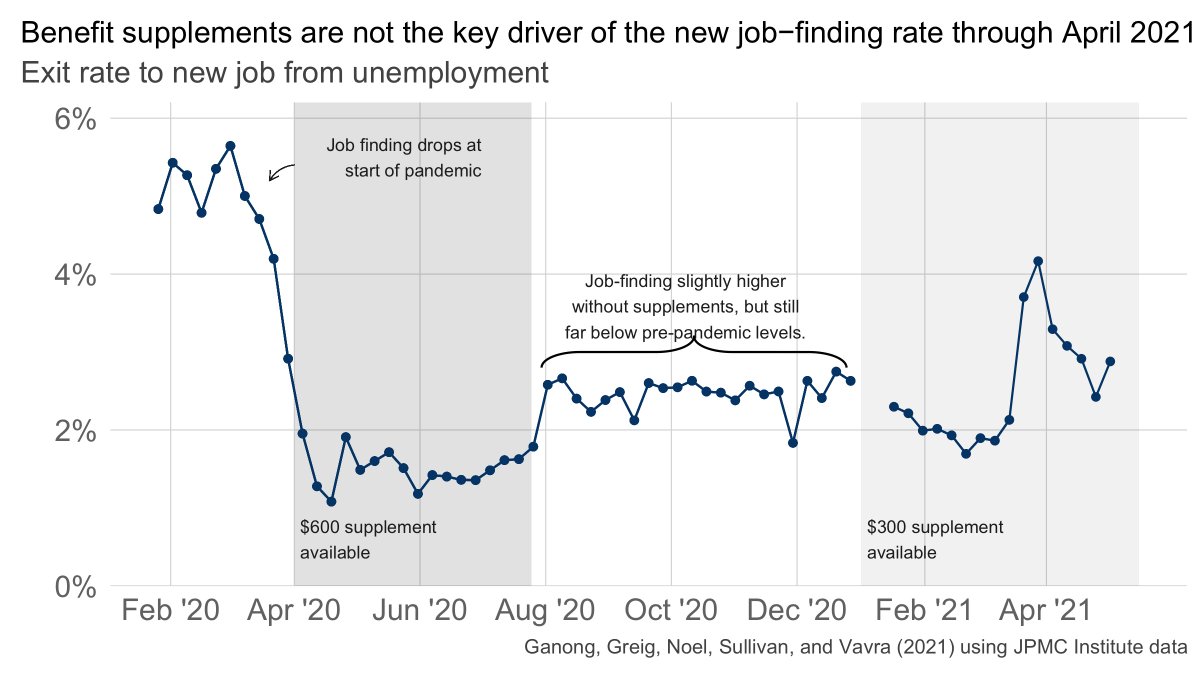
^ The orange line for 2020 when PUC available, is radically different -- much more income paid out and much higher spending too
One clear way to see the neutrality result regarding how macro conditions don't change the spending drop at unemployment is to compare the drop in 2009 when the economy was tanking and in 2019 in the white hot labor market

The spending drop from unemployment is the same in both!
(Important piece of context: *everyone's* consumption fell in the Great Recession, but that gap between employed and unemployed was constant.)
They also find that households with lower pre-job loss income and lower pre-job loss liquidity have higher MPCs during unemployed
Finally, they show a striking neutrality result regarding racial inequality: after taking into account income and liquidity, there are essentially no *residual* MPC differences by race/ethnicity.
What this means is *not* that race doesn't matter for the MPC. Rather, it means that those differences are mediated by income and liquidity. This echoes the neutrality result in prior work with the same data by @nomadj1s @pascaljnoel nber.org/papers/w27552
Thread by author @chrisowheat on their new research is here
Full report is here jpmorganchase.com/institute/rese…

Congrats to @chrisowheat @FionaGreigDC @g3ontheweb @melissaobrien_1 @shantanuatx on a great new paper, which I encourage everyone to read!

• • •

Missing some Tweet in this thread? You can try to force a refresh
 

Keep Current with Peter Ganong

Peter Ganong Profile picture

Stay in touch and get notified when new unrolls are available from this author!

Read all threads

This Thread may be Removed Anytime!

PDF

Twitter may remove this content at anytime! Save it as PDF for later use!

Try unrolling a thread yourself!

how to unroll video
  1. Follow @ThreadReaderApp to mention us!

  2. From a Twitter thread mention us with a keyword "unroll"
@threadreaderapp unroll

Practice here first or read more on our help page!

More from @p_ganong

23 Aug
Amazing new paper by @amirrkermani @francisawong on the racial gap in housing returns.

Black and Hispanic households see their housing wealth grow less, contributing to the overall racial wealth gap substantially.
The large raw differences are mostly about differences in borrower characteristics, particularly about *place* of purchase.
The returns gap is 1) amplified by high leverage and 2) entirely concentrated in distressed sales (foreclosures and other sales arising out of delinquency).
Read 6 tweets
20 Aug
Millions of people have had federal UI benefits cut off

Stated goal: speed the labor market recovery.

Is it working?

Tldr: Nope. Per person losing benefits, net employment changes by -0.14 to + 0.08. Uncertainty remains large.
What makes today special? BLS releases state employment data, so we can compare July employment in states that cut off benefits and states that did not.

The new data capture employment during the payroll period containing July 12. @pascaljnoel and @JoeVavra and I analyze.
First, we plot the change in employment by state, coloring each state by whether they terminated benefits
Read 19 tweets
6 Aug
Tomorrow is jobs day and everyone wants to know how early cut off of pandemic benefits will affect employment

I can tell you the answer tonight... you won't learn anything tomorrow‼️

no state data are released ‼️

🧵 on evidence from 5 other data sources that *are* by state
TLDR: four data sources point to no significant/detectable effect, one data source finds a decrease in employment. issues with parallel trend assumptions and inference are plentiful though.
1) The BLS releases state-level employment estimates based on the establishment survey two weeks after the national numbers. For July data, have to wait until August 20. Analysis of the June state-level estimates is here. Looks like a noisy zero.
Read 11 tweets
29 Jul
New research on Pandemic Unemployment Assistance by JPMC Institute w @FionaGreigDC @Dan_M_Sullivan @pascaljnoel @JoeVavra

PUA is for people not eligible for regular UI

PUA meaningfully insures inc risk, but w/much longer wait for benefits!

jpmorganchase.com/content/dam/jp…
The plot above shows that for people who got regular UI in 2019, non-UI income falls at exactly the same time that UI kicks in (green line).

Regular UI in 2020 (orange line) income starts to fall four weeks before UI kicks in

PUA (blue) income starts to fall ten weeks before
There is also a smaller decline in income after UI receipt for the blue line. Two likely interpretations:
--PUA recipients account for smaller share of HH income
--some PUA recipients have already gone back to work by the time they finally get their benefits
Read 4 tweets
29 Jul
🚨new results on the effect of UI supplements on job-finding 🚨

2 designs x 2 policy changes yield consistent pattern: small, precisely estimated disincentive effects

Disincentive remains small even after job openings up
An overarching theme of the pandemic has been to view the supplements as responsible for the biggest problems (slow employment recovery, usually conservatives) and the biggest successes (rising wages at the bottom, usually liberals).

Our results are inconsistent with both views.
Instead, it makes sense to think of the effects of pandemic UI primarily as an ambitious anti-poverty policy. I can’t think of a time before when a country gave *full* insurance to earnings losses (examples welcome in the comments)
Read 22 tweets
28 Jul
Why is UI hard to access?

Most policy discussions (rightly) focus on issues of state capacity.

Amazing paper by Sorkin, Lachowska, and Woodbury focus on *firms* who make it hard to get UI and the seamy underbelly of experience rating.
I think of this as the academic paper which captures @IndivarD's political economy model of a major problem with the UI system
Experience rating is the system where firms that lay off more workers pay more in UI taxes.

Goal: discourage layoffs
Read 6 tweets

Did Thread Reader help you today?

Support us! We are indie developers!


This site is made by just two indie developers on a laptop doing marketing, support and development! Read more about the story.

Become a Premium Member ($3/month or $30/year) and get exclusive features!

Become Premium

Too expensive? Make a small donation by buying us coffee ($5) or help with server cost ($10)

Donate via Paypal Become our Patreon

Thank you for your support!

Follow Us on Twitter!

:(