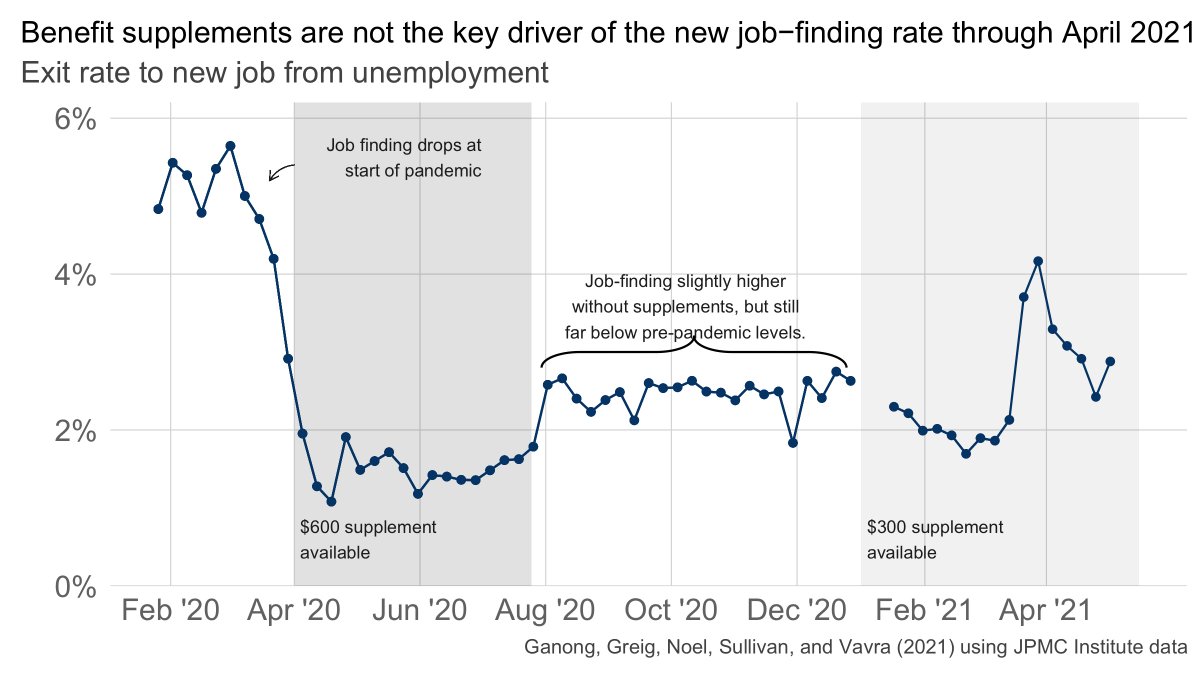
Millions of people have had federal UI benefits cut off
Stated goal: speed the labor market recovery.
Is it working?
Tldr: Nope. Per person losing benefits, net employment changes by -0.14 to + 0.08. Uncertainty remains large.
Stated goal: speed the labor market recovery.
Is it working?
Tldr: Nope. Per person losing benefits, net employment changes by -0.14 to + 0.08. Uncertainty remains large.

What makes today special? BLS releases state employment data, so we can compare July employment in states that cut off benefits and states that did not.
The new data capture employment during the payroll period containing July 12. @pascaljnoel and @JoeVavra and I analyze.
The new data capture employment during the payroll period containing July 12. @pascaljnoel and @JoeVavra and I analyze.
First, we plot the change in employment by state, coloring each state by whether they terminated benefits 

Second, although no sharp patterns pop out above, there still could be a small average effect.
So far, 26 governors have announced plans to cut off at least some federal benefits. 21 states are cutting off all benefits by July 5. This is where we might expect to see big fx.
So far, 26 governors have announced plans to cut off at least some federal benefits. 21 states are cutting off all benefits by July 5. This is where we might expect to see big fx.
There are (at least) two types of uncertainty: (a) sampling uncertainty because BLS uses a survey of firms and (b) counterfactual uncertainty because states that cut off benefits and states that didn’t differ in important ways!
To address (a), use standard errors provided by BLS. To address (b), use
The natural thing is to compare all states that cut off benefits with all states that didn’t. These states differ in important ways!
The natural thing is to compare all states that cut off benefits with all states that didn’t. These states differ in important ways!
We consider two cases:
1. Difference in trends from October to May continues into June
2. Difference in trends from January to May continues into June
We interpret these cases as giving lower and upper bound point estimates.
1. Difference in trends from October to May continues into June
2. Difference in trends from January to May continues into June
We interpret these cases as giving lower and upper bound point estimates.

We also explore different definitions of treatment (e.g. dropping states where benefits restored through litigation, adding states where only the $300 was terminated).
One more natural question is how many jobs were created on net for each person who lost benefits. (Lost benefits can mean either lost all benefits or lost the supplement.) 

The analysis done here was filed as a pre-analysis plan which you can read here
drive.google.com/file/d/1FOfijb… (I don’t have an OSF link yet)
drive.google.com/file/d/1FOfijb… (I don’t have an OSF link yet)
https://twitter.com/p_ganong/status/1428514316215623690?s=20
If you want to read more about this, here are a few links: we analyzed the effect of the $300 supplement here
https://twitter.com/p_ganong/status/1420716432225144834?s=20
There’s also a great analysis using bank data from an app
https://twitter.com/arindube/status/1428671530532319244?s=20
And analysis using CPS micro data by @JedKolko
https://twitter.com/p_ganong/status/1427785421031886855?s=20
@bencasselman analyzes the same SAE data we do here (and helpfully caught a mistake in our standard errors!)
https://twitter.com/bencasselman/status/1428732961256509454?s=20
Finally, I should add a little more about why uncertainty remains large. In some months in the past there have been big shifts between terminating and non-terminating states, even with no policy changes! 

So maybe termination raised employment quite a bit and there was some offsetting shift. Or maybe termination led employment to fall quite a bit and there was some offsetting shift.
Another great thread by @gelliottmorris reaches the same conclusion
https://twitter.com/gelliottmorris/status/1428835427520241664?s=20
Q from @sdonnan: why does @VanceGinn have the “opposite” conclusion?
A: you can cherry pick treatment group to find small negative or positive effects.
A: you can cherry pick treatment group to find small negative or positive effects.
https://twitter.com/p_ganong/status/1428741126270472203?s=20
Finally, a lot of the responses on Twitter are “duh, this is obvious”. I disagree. Economists have found substantial disincentive effects of UI in many prior credible studies. In the coming years economists will hopefully study what makes this time different.
• • •
Missing some Tweet in this thread? You can try to
force a refresh


