Descriptive analysis #Covid19 dynamics April-August 2021.
Total population analyses might distinguish between indiviual- and group risk of infecion.
Data rivm sourced:
Total population analyses might distinguish between indiviual- and group risk of infecion.
Data rivm sourced:

Summer 2021 allowed for easing #Nonpharmaceuticalinterventions.
Vaccination effort was geared up.
Alpha was mostly the dominant VOC.
outbreak.info/location-repor…
Vaccination effort was geared up.
Alpha was mostly the dominant VOC.
outbreak.info/location-repor…

Given age-stratified #TestTraceIsolate population wide CaseFatalityRates (nCFR), estimates were compared to cbs reported excess mortality, adjusted for absence of Influenza etc, and compared to the rivm estimated prevalence of contagious people: 

Virus population prevalence, i.e. number of contagious people infecting R(0) contacts was generally higher for #B117 as compared to wildtype #SARSCoV2.
The virulence of #Alpha was generally higher than for previous variant(s).
Mortality #Covid19 was higher than reported:
The virulence of #Alpha was generally higher than for previous variant(s).
Mortality #Covid19 was higher than reported:

Comparison of various @ rivm and cbs validated sources would infer a time weighted average virus prevalence during the summer 2021 of ~2,8%.
Info fully vaccinated, status per week and year of birth:
rivm.nl/covid-19-vacci…
Info fully vaccinated, status per week and year of birth:
rivm.nl/covid-19-vacci…

Real time epi data allow for descripive analyses. Given population stratified, weighted data for age, testing, vaccination and mortality risk as indepent variables, a regression model can generate hypotheses:
Fatality% = -108.9 + 9.7 InfectionRisk% - 0.5 %Vaxx'd + 1.8 Age:
Fatality% = -108.9 + 9.7 InfectionRisk% - 0.5 %Vaxx'd + 1.8 Age:

During the observed period a 1% risk of infection in the entire population increases population fatality risk by 10% independent of vaccination status and age.
However: Fatality risk dependent on age given a certain level of infection risk and vaccination is not linear related:
However: Fatality risk dependent on age given a certain level of infection risk and vaccination is not linear related:

Vaccines prevent death and serious disease for the study population included in clinical trials as approved by health regulatory agencies.
Table of predicted group fatality risks at ~ 1% infection risk.
A negative number would indicate #zeroCovid risk, 0, niks, nada, nil 😃
Table of predicted group fatality risks at ~ 1% infection risk.
A negative number would indicate #zeroCovid risk, 0, niks, nada, nil 😃

Disclaimer:
Dependent on data, sources and rounding errors.
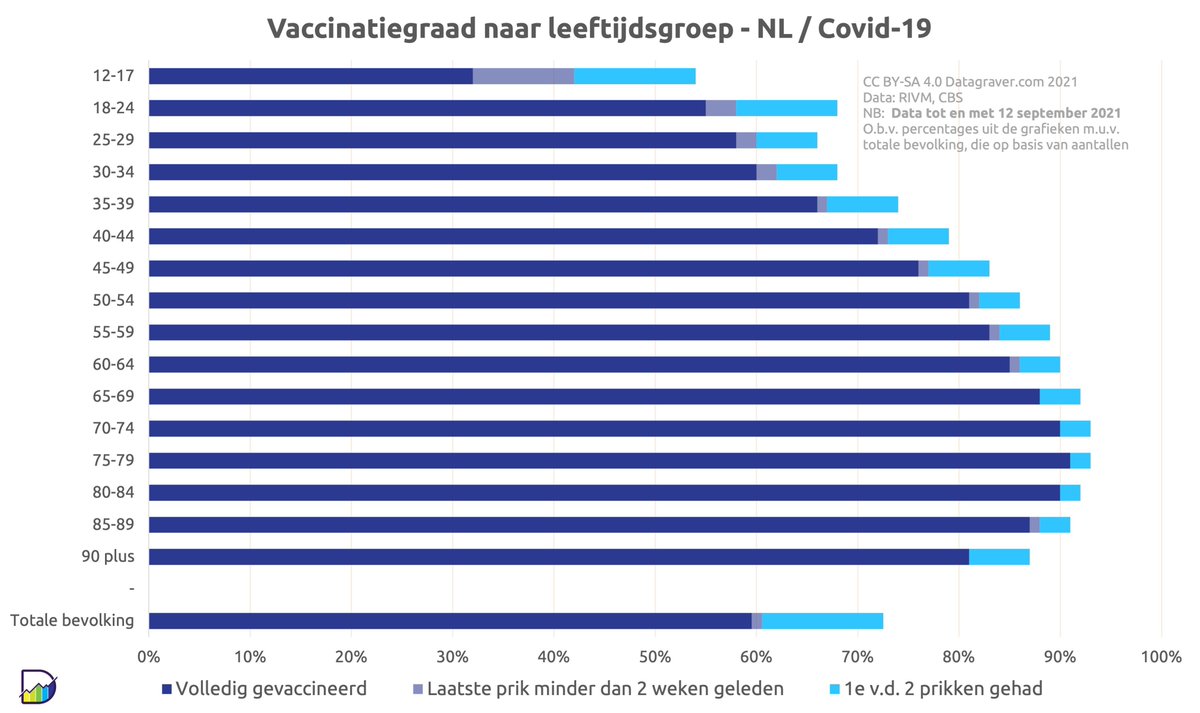
h/t @Datagraver for age stratified graphs.
h/t statskingdom.com/410multi_linea… for regression calculator.
Dependent on data, sources and rounding errors.
h/t @Datagraver for age stratified graphs.
h/t statskingdom.com/410multi_linea… for regression calculator.
Applying a multiple regression analysis to the current epidemiological situation, assuming infection risk and vaxx status will remain at the same level upcoming winter, an estimate of expected excess- and Covid19 population mortality could be generated. 


Real time epi data allow for descriptive analyses. Given population stratified, weighted data for age, testing, vaccination and mortality risk as indepent variables, a regression model can generate hypotheses:
Fatality% = -108.9 + 9.7 Inf.Risk% - 0.5 %Vax'd + 1.8 Age:
Fatality% = -108.9 + 9.7 Inf.Risk% - 0.5 %Vax'd + 1.8 Age:

Assuming infection risk and vax status will remain at the same level next 26 weeks; relatively high virus prevalence may lead to > 18.000 elderly #Covid19 preventable deaths (~20% of expected all cause cbs mortality), which is consistent with a continuous 10% excess mortality. 

Disclaimer: Comparative data different sources is provided for generating hypotheses only, is not intended to be precise nor reliable. Rounding errors occur, data varies over time, new virus variants may pop-up again and population behaviour may change.
https://twitter.com/falsel_net/status/1410854297579970563
🧵 Whereas the model described⤴️ simply provides for a rational #zeroCovid policy,
the model described⤵️ proves, according to same logic, reducing community transmission #SARSCoV2 should be the ultimate goal of public health policies.
bmj.com/content/374/bm…
h/t @JuliaHCox
the model described⤵️ proves, according to same logic, reducing community transmission #SARSCoV2 should be the ultimate goal of public health policies.
bmj.com/content/374/bm…
h/t @JuliaHCox

Indeed, @FT seems to derive at the same conclusion:
Mortality is closely linked to age. Unfortunately, even among the vaccinated, the age gradient remains.
There is no alternative to #zeroCovid public health.
ft.com/content/0f11b2…
Mortality is closely linked to age. Unfortunately, even among the vaccinated, the age gradient remains.
There is no alternative to #zeroCovid public health.
ft.com/content/0f11b2…

@threadreaderapp please unroll
• • •
Missing some Tweet in this thread? You can try to
force a refresh


