#MarsiliosTA

Follow up on S & R levels to show a couple short term examples

Weekly & daily pivots important for trend, and pullbacks to the WP or DP often great buys in uptrend.

But also because entire structure is more clustered, S & R levels a lot more likely to trade.
BTC 1H chart with

All levels plus weeklies
Fibonacci weeklies in red
DeMark weeklies in orange

No daily levels for clarity

This week near tag of yearly level (YR2 as support), but no other half-year, quarterly or monthly levels in play at all

Action all on weeklies
Arrows are just showing turns - sometimes chop, it happens

1st brown = fail at WP then down
1st red = Fib S1 low
green = WS1 low of week
2nd brown = WP chop a bit
2nd red = Fib R1 resistance
3rd brown = WP pullback hold

Crypto traders if you are not interested this...
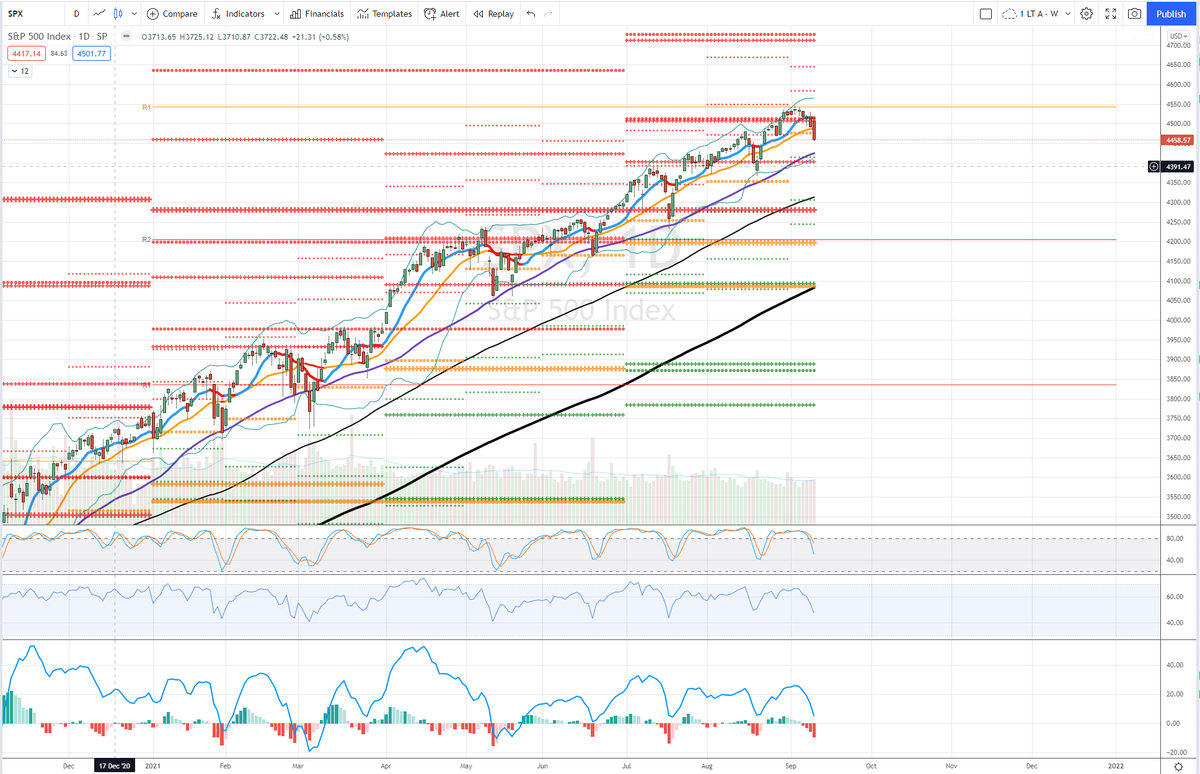
ES

Quiet holiday week, tight range

Same setup

As it so happened, one top very near a monthly R1 (how do I know? because dots extend more than 1 week) and a quarterly level acting as support (same idea)

Highs near DeMark WR1 with poke above but not close above today in orange
So, this stuff does work but there are a lot of levels and once we add dailies then there will be levels everywhere, so how to judge?

Some traders use pivots alone

I prefer to combine other tools into system

And for that... come back next installment

unroll @threadreaderapp

• • •

Missing some Tweet in this thread? You can try to force a refresh
 

Keep Current with Marsilio's Market Musings

Marsilio's Market Musings Profile picture

Stay in touch and get notified when new unrolls are available from this author!

Read all threads

This Thread may be Removed Anytime!

PDF

Twitter may remove this content at anytime! Save it as PDF for later use!

Try unrolling a thread yourself!

how to unroll video
  1. Follow @ThreadReaderApp to mention us!

  2. From a Twitter thread mention us with a keyword "unroll"
@threadreaderapp unroll

Practice here first or read more on our help page!

More from @MarsiliosMM

15 Sep
#MarsiliosTA

Bollinger bands

Interesting concept - 20MA, then 2 standard deviations away from it create the bands - you can also edit the MA

It does work - like all market indicators, nuance required for best results

If really interested read the book by the creator
Here's BTC with just the daily BBs

So how does this work?

Sometimes taking reversal trade on band is awesome, sometimes slaughtered

Context is key
Slope matters a lot
Divergence is what the pros look for

To explain...
Power move, up or down, is high & close outside the band with the band sloping strongly in direction of the trend - this usually (not always) means continuation

You have to review charts to get this concept but now I will mark arrows with this power move outside band
Read 9 tweets
12 Sep
Also should I continue TA threads?

See hashtag #MarsiliosTA for intro to

pivots
simple MAs
tweaked MACD

combined these give us great idea of "trend" and is my core positioning guidance

if continuing, then:
Bollinger bands & how I use them - divergence & spotting reversals, 1st stage in change of trend

Along with the momentum indicators RSI (better) and stoch (more like early warning, I don't use this much)

Already sketched entry idea, but really I have 3 setups, & 2 variations
Then we have risk management, when to hold, when to cut, stops

Exits - actually back to MACD histogram for this, along with all else
Read 4 tweets
12 Sep
Total Sum

Stocks have gone further & smoother than I ever imagined at start of 2021, unprecedented rally with SPX above smoothly rising D50MA since election except, count them, 2 days!

Obv aided by US tech, GOOGL +60%, MSFT +32%, banks also up decently, energy, pretty broad
And whether market tops on the "worst astro" (maybe just in?) or has even more massive blow-off next year with Jup in Pisces remains to be seen

Near term however, everything lining up for Sept smash

All major index TA
VIX, with VXX SVXY nearly there
Astro many ways weak ahead!
Preferred scenario is risk assets down to end Sept & then another low 10/8-10/10

For stocks probably not easy as aggressive dip buyers have made a lot of $, and indexes come back over and over

This is a sharp counter-trend call but that's how I see it
Read 6 tweets
12 Sep
Index TA

Now some of these lines will make more sense to those who read TA threads

DJI exceeded QR1 AugR1 combo for 2 trading days, since then levels as resistance; slight poke above QR1 9/2 (small red arrow)
Broke SepP 9/7 (orange)
Broke D50MA 9/9
Back under YR1 9/10 (red)
This is significant technical deterioration in short amount of time

Medium term levels acting as resistance
Pivot status change
Break of D50 & yearly level

So, comeback or smash? With astro, thinking smash
SPX

HR1 QR2 resistance
Sept pivot break

Still far above D50MA though
Read 8 tweets
12 Sep
Astro (long thread)

Pluto Rx in Capricorn-Saturn from 6/29
Saturn ruling sign & term, should be quite nasty, these 4' among worst in zodiac. Though some bond rally & covid again, muted impact for markets.

FOMC has twisted everything:

Bad news = QE pumping = good for markets
Could worst astro produce big top? Maybe, but depends on taper schedule; more likely is slow taper & gradual hike so perhaps big blow-off top next year 2022

Neptune in Pisces-Mars from 1/23, Rx from 6/25
Expected volatility & larger moves both ways; this term in play a while
Uranus in Taurus-Jupiter from 7/7, Rx from 8/19
Think this is helping tech & cryptos with Jupiter in Aqu

*

Saturn Rx in Aqu-Ven 6/18
Saturn worse out of term Jupiter, & helping safe havens lift when triggered; but not hitting that hard in big picture

Might take direct?
Read 15 tweets
12 Sep
Full market analysis ahead:

Review
Astro
TA (just a bit)
Sum with next forecast

Check threadreader post after each section

Read what sections interest you

This process has resulted in many accurate takes on major asset classes - focus on indexes, cryptos & safe haven trades
Many - but not all - accurate statements from last week:

From spread,
Indexes: "Prefer 9/6-8 trading top, then lower into following weeks"
Good for indexes so far, main futures made highs 9/2-7 and tests 9/6, leader NQ 9/7 high, then all lower
This gets check!
Cryptos: "Same, but less damage expected, could stretch to 9/10 top"
Ugh, 9/6 key high, but more damage

Hottest coins SOL ALGO LUNA highs closer to 9/10, and ATOM pushing higher today

I don't have different astro on every coin, only general conditions, TA for the rest
Read 11 tweets

Did Thread Reader help you today?

Support us! We are indie developers!


This site is made by just two indie developers on a laptop doing marketing, support and development! Read more about the story.

Become a Premium Member ($3/month or $30/year) and get exclusive features!

Become Premium

Too expensive? Make a small donation by buying us coffee ($5) or help with server cost ($10)

Donate via Paypal Become our Patreon

Thank you for your support!

Follow Us on Twitter!

:(