Mindo Profile picture
Sep 5, 2021 12 tweets 4 min read Read on X
Mini Case Study Thread

Building Your Trading Idea:

So we talk about finding confluence with moves and trying to build a bit of narrative for where price is likely to reach up or down to

I'll take a look here at how a possible $UNI trade could be developed:
Start with HTF key closes ie Monthly, Weekly, and Daily.

I've gone ahead and marked these up, but consolidated on the Daily Chart
Here's a 4H version of these levels.

Note how price acts within these key HTF zones
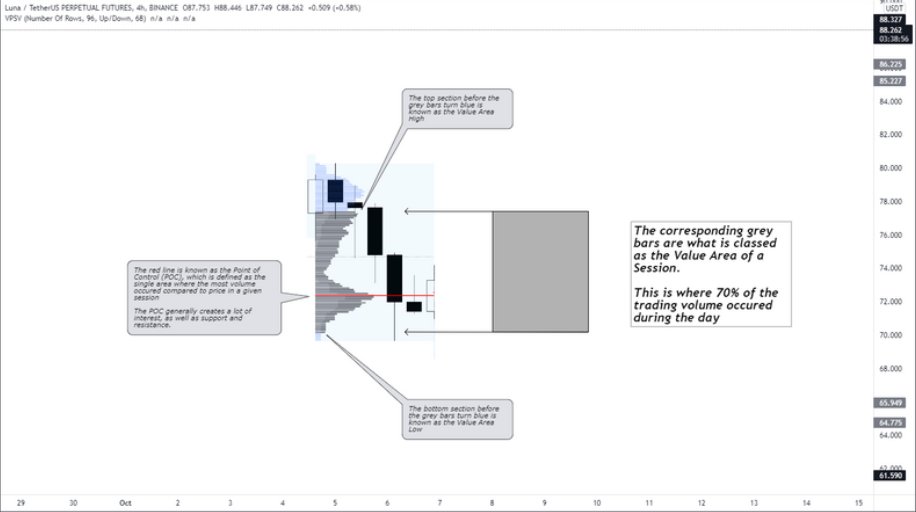
Using the VPVR tool from Tradingview, we can see where the most volume has taken place within the area that we are looking at on the chart.

Notice that we are just trading above the Point of Control for this area (and also just below the recent monthly close)
So are we bearish or bullish? In this case, let's explore with fibs and PA

We're looking like we've had two higher lows, followed by a rally up past recent market structure (shaded rectangle) and formed a swing high.

(HTF levels turned off for clarity)
We'd expect price to fall back to the 0.618 - 0.705 levels, but with instances of sharp moves like this (think flags etc), you'll find that price respects the 0.382 and 0.5 levels more than our usual targets.

And, we have seen a bit of a spike at the 0.5 level per the chart.
On the 1H chart, we also see a rounded bottom / reversal move play out, which supports our hypothesis.

In this case, I would be bullish.
Taking it the next level down to the 15M TF, we turn our HTF levels back on, and then also include our favourite suite of entry / exit / target fibs
If pull your fibs in anticipation of where a bullish trade could run into trouble, you find confluence with:

- A weekly level
- The 0.618 to 0.79 levels of the fibs
- Not only that, but you'd also find that there was a previous POC in between the 0.618 and 0.705 levels
And entry and targets?

See below for an example of a trade based on retracement to realistic market structure, and then an end goal of the Daily swing high, with profits taken at the Weekly level / POC interface explored above / reverse fib zones.
Stop Loss *could* be placed below the HTF recent lows, or if aggresive, then at more local swing lows

This example is a 3.45R trade
And what if price flips and is bearish I hear you ask?

Well, you've now got the tools to at least formulate a plan...we aren't always right, but as long as we've got a plan, this is half the battle hey?

Hope this helped you on your journey, and happy trading

- Mindset

• • •

Missing some Tweet in this thread? You can try to force a refresh
 

Keep Current with Mindo

Mindo Profile picture

Stay in touch and get notified when new unrolls are available from this author!

Read all threads

This Thread may be Removed Anytime!

PDF

Twitter may remove this content at anytime! Save it as PDF for later use!

Try unrolling a thread yourself!

how to unroll video
  1. Follow @ThreadReaderApp to mention us!

  2. From a Twitter thread mention us with a keyword "unroll"
@threadreaderapp unroll

Practice here first or read more on our help page!

More from @Mindset_BTC

Nov 15, 2022
Nearly a year ago, I shared Price Action Principles: Trading a Range - a free 7 part course that gives a mild intro into SMC & other concepts.

This thread is about Volume Profile from Module 3 (course is in the last tweet) with:

- VAH & VAL
- POC's
- FRVP Tool

Enjoy!
What is Value Area Trading?

We're using @tradingview's tools, so let's use their terminology:

"Volume Profile is an advanced charting study that displays trading activity over a specified time period at specified price levels."
In my own words:

In a given or visible price range, the Value Area can be defined as where 70% of the volume of price was transacted in said given or visible range

This range has a Value Area High, Value Area Low, Point of Control, & High & Low Value Nodes
Read 17 tweets
Oct 2, 2022
Here's my 100 weeks of backtested $EURUSD price action from June 15 2020 to 09 May 2022, here's what is covered:

- Occurrence of high & low of the week
- % of high and low of the week per day
- % of Mondays high / low being swept on a given day

Took me a while, hope you enjoy
The high and low of the week

Here we can determine that the low of the week fell 38/100 times on a Mon, while the high of the week was also most likely to form on this day too with 31/100 occurrences

Note that there's during the week, there's more of a spread compared to $BTC
Percentage / Chance wise, you can see that Monday is more likely to be the low of the week by a factor of 5, 2, and 3 compared to a T, W, or Th respectively

Friday is different though.

With the high of the wk, Monday leads, followed by a Thurs, then Friday.
Read 13 tweets
Aug 31, 2022
I made a free Price Action course not long ago - I'll share some detailed threads on portions of the course so you don't have to spend hours watching them when trading #Bitcoin & #Altcoins

We'll jump ahead to Module 4 - Ranges & Targets.

Why? Because I loved sharing this one!
What's in a Range?

A range is simply defined by anchoring two points on a chart based on:

A timeframe (daily, weekly, monthly etc)
Market structure
Or a combination of both

The method I use to anchor the range is a Fibonacci Tool, with values set at 1, 0.5, and 0
Range Tool Setup 1/1

1) First Select the 3rd item down on the left hand side menu
Then select "Fib Retracement"

2) Open up the settings of the Fib Retracement Tool, then set up the Fib tool to show the 0, 1, and 0.5 levels
Read 18 tweets
Aug 20, 2022
I've got a surprise for you with another strategy release on @tradingview for #Bitcoin & #Altcoins

bit.ly/Mindjacked_Sca…

- SRSI & Optional EMA's
- Different SRSI conditions for signal
- Session Filter (Set to your waking times)
- 3 Commas Integration
- TP / SL %'s

Read on:
SL / TP %

You can set the strategy to the SL & TP levels that you'd like in terms of % (make sure youamend the pos size though to suit your SL %)

The general strategy is based on Stochastic RSI & EMA's, but you can turn off the EMA's as needed, & just run with SRSI.
There's also a neat funcion called Use Exit Condition

If you set the SRSI to 80 for overbought, & 20 for oversold & you enter a short at 80, there will be a signal to close at the opposing metric.

In this case, it would be the 20 level at the SRSI condition you set for a long
Read 10 tweets
Aug 16, 2022
The Trend Continuation fibs - covered in upcoming Module 3

Of course these are originally based on the ICT fibs, but nuanced per the following for #crypto & #bitcoin

- 0.72 entry point
- A negative 0.12 level
- 0.28 level

Why though? Image
The 0.72 Entry Point:

The reason for this is simple - it's the mid point of the 0.66 and 0.786 levels of the fib, where I've personally found much better entries and setups using this Image
The negative 0.12 level:

Included in this particular suite of fibs because you're looking for a get in, get out move that simply beats previous market structure.

By entering at the 0.72 level, this -0.12 level yields a 3RR move if the SL is at 1.

It just keeps it simple Image
Read 7 tweets
Aug 13, 2022
I backtested 100 weeks of $BTC #bitcoin price action from June 15 2020 to 09 May 2022, was able to determine the below:

- Occurrence of high & low of the week
- % of high and low of the week per day
- % of Mondays high / low being swept on a given day

8 hrs of research for you:
The high and low of the week

Here we can determine that the low of the week fell 43/100 times on a Mon, while the high of the week was also most likely to form on this day too with 27/100 occurrences

The rest of the days are generally similar, bar Tuesday lows & weekend highs
Percentage / Chance wise, it's obviously a no brainer in the fact that given the sample data of 100 weeks, that the % are simply a given of the numbers above
Read 12 tweets

Did Thread Reader help you today?

Support us! We are indie developers!


This site is made by just two indie developers on a laptop doing marketing, support and development! Read more about the story.

Become a Premium Member ($3/month or $30/year) and get exclusive features!

Become Premium

Don't want to be a Premium member but still want to support us?

Make a small donation by buying us coffee ($5) or help with server cost ($10)

Donate via Paypal

Or Donate anonymously using crypto!

Ethereum

0xfe58350B80634f60Fa6Dc149a72b4DFbc17D341E copy

Bitcoin

3ATGMxNzCUFzxpMCHL5sWSt4DVtS8UqXpi copy

Thank you for your support!

Follow Us!

:(