Belated Wed. #covid19ab brief:
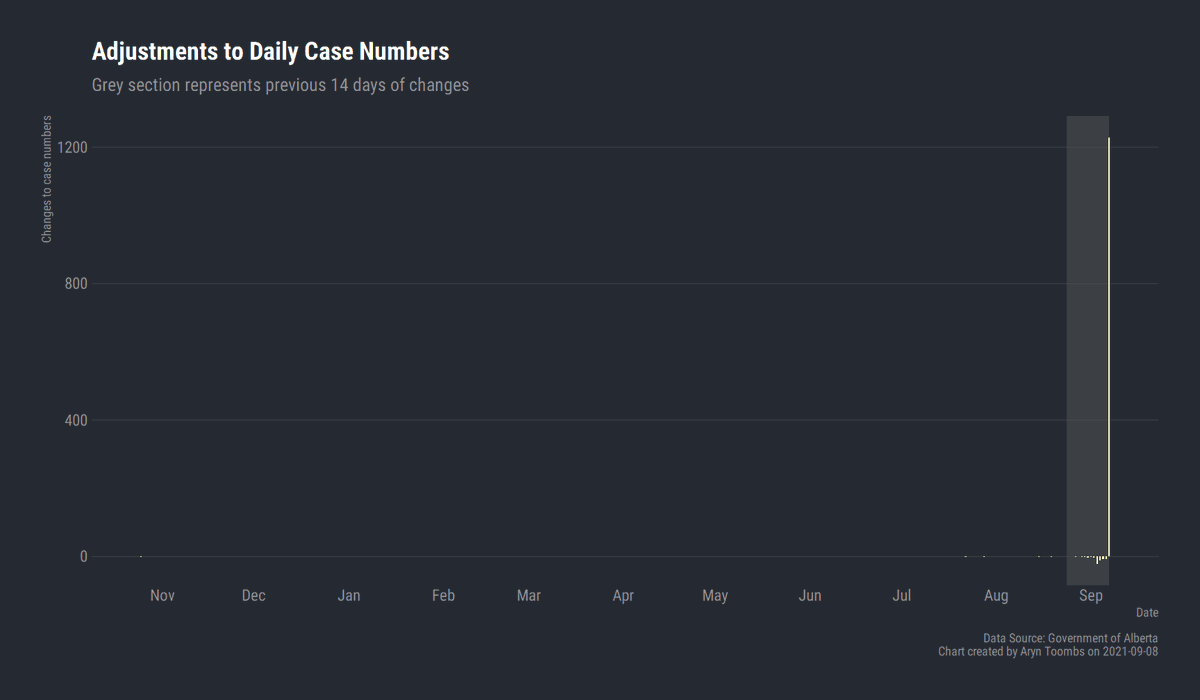
• 1229 new cases (-63 to previous days)
• 7 day trend is now 1293
• +132 active cases to 15,618
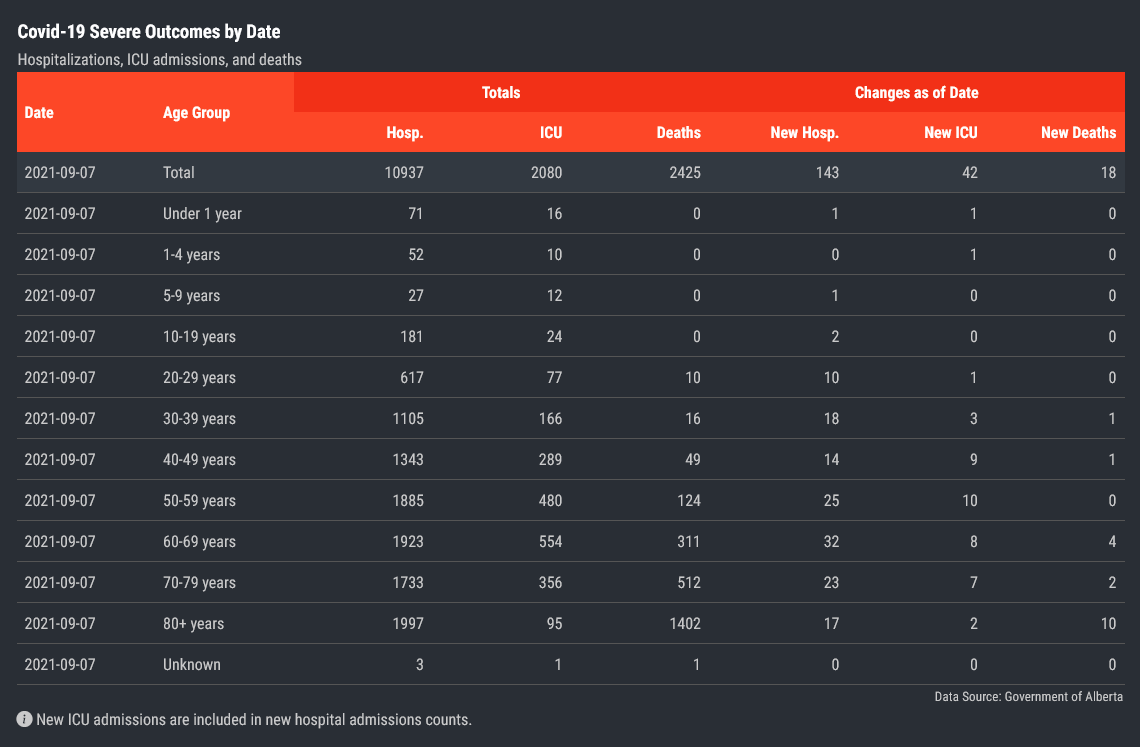
• +45 hospitalizations to 647 (+16 to previous days)
• 18 new deaths
And the daily adjustment chart with net 63 cases being removed between October 25th, 2020 and September 6th, 2021.
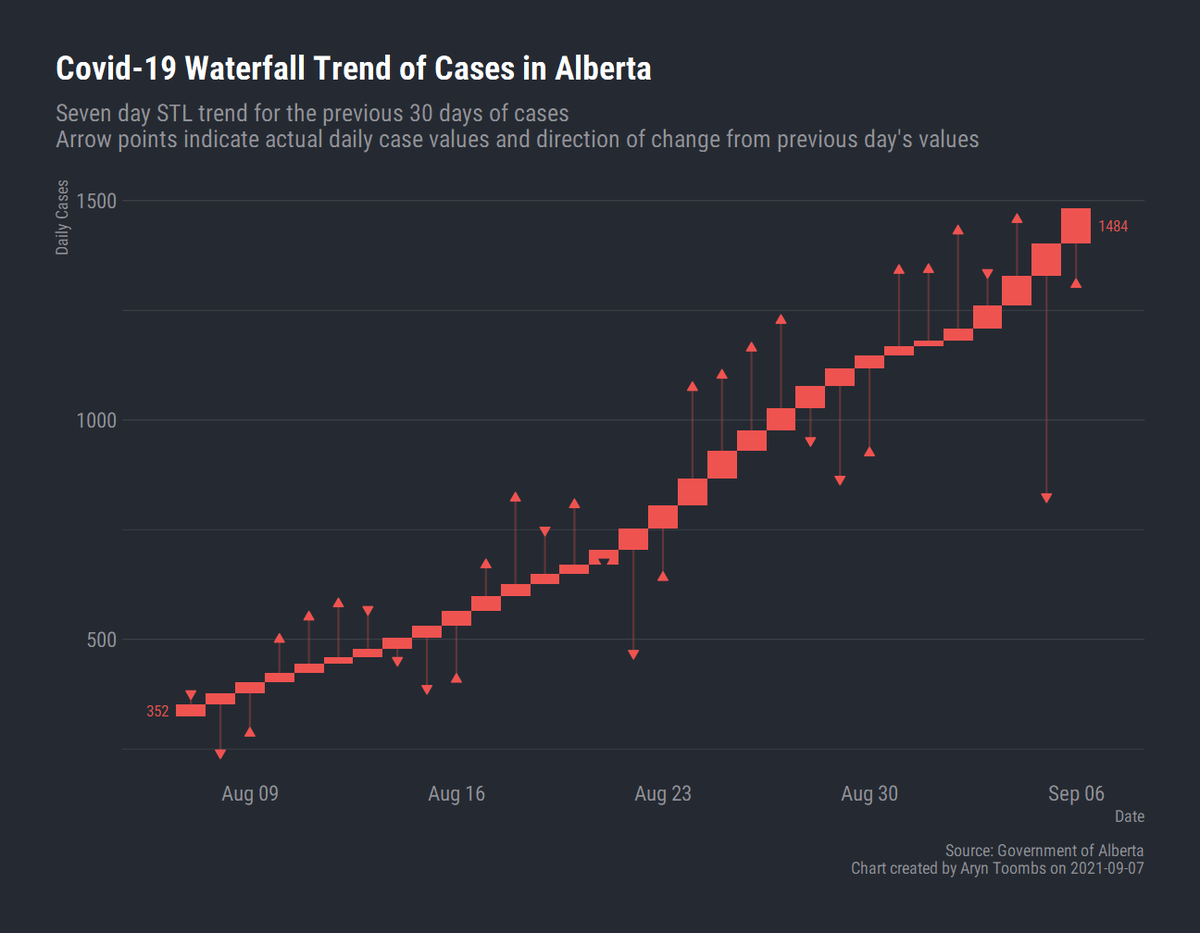
The 30 day waterfall chart for the trend in #covid19ab cases with whiskers for actual daily cases reported.
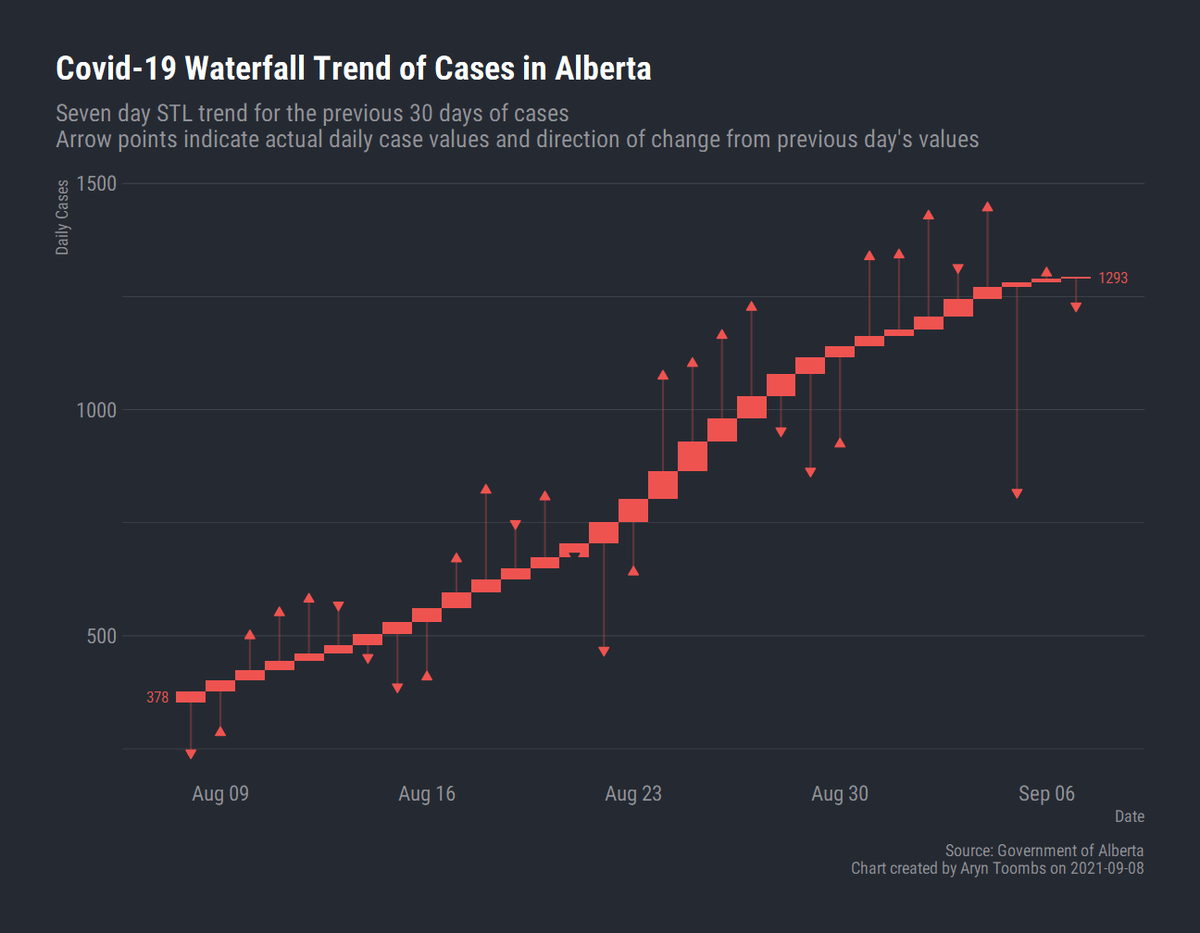
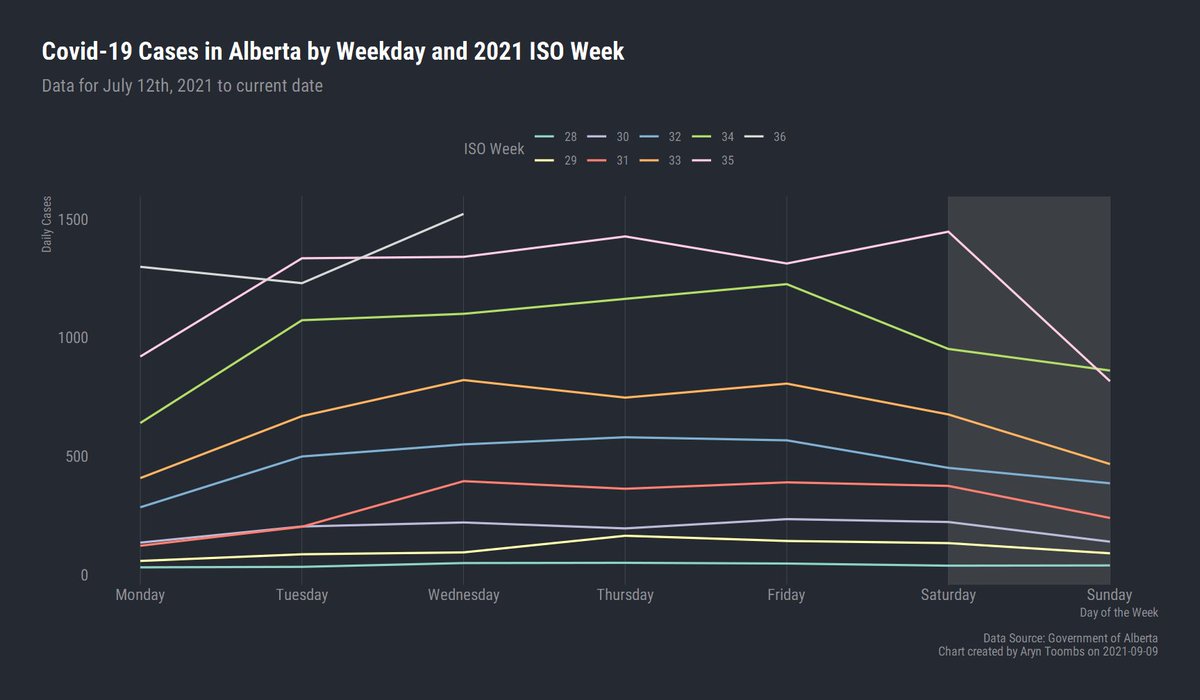
This is the first time during the fourth wave that we've seen a pattern in cases different to previous weeks. With the percent positivity this high, accuracy on daily cases is decreased making this an interesting chart to watch.
With the school #covid19ab outbreak threshold changed from an absolute value to a percentage this year, we're going to see a lot less outbreaks even if schools have the same number of cases. 🧵👇
Thus far from the 13 outbreaks publicly announced, using 2020/2021 enrollment estimates, the schools range from 65 to 839 students with the median school size ~240. This is well below the overall median of ~320 for all schools in Alberta.
So why does this matter? It matters because it takes a lot more cases in terms of raw numbers for a high school like Harry Ainlay school in Edmonton with its nearly ~2,900 students to be declared an outbreak than Beacon Heights with ~150.
Thursday #covid19ab brief:
• 1522 new cases (-12 to previous days)
• 7 day trend is now 1247
• +359 active cases to 15,977
• +32 hospitalizations
• 9 new deaths aryntoombs.github.io/brief/
The daily case numbers rise back up for Wednesday numbers restoring the day over day rising trend post Labour Day.
Tuesday #covid19ab brief (Fri-Mon #s):
• 1336, 1457, 825, 1309 new cases (-6, -7, -5, -6 to prev days)
• 7 day trend is now 1484
• +87 hospitalizations from Fri (515 to 602)
• +1,991 active cases to 15,486
• 17 new deaths
30 day waterfall chart of #covid19ab trends, and whiskers for actual daily cases. And as indicated last Friday the recalculation removed the flattening once the entire week's data was available.
Rodeos and #covid19ab? Probably not what you think, or at least not for all Rodeos. A thread:
Looking at the active cases post Alberta Rodeos gives us some interesting results. As the data shows, only one Rodeo stands out and was the La Crete Rodeo in the High Level LGA.
We can compare this again with the vaccination rate versus the growth rate (max active at 21 days - active at the start of the Rodeo) and La Crete stands out as an extreme outlier.
We can compare this to all of the other Rodeos, where even though we see some pickup of some cases after 14 days, these are very small in real numbers compared to the massive growth post 14 days for La Crete.