Israel 🇮🇱, booster 💉💉💉, and herd immunity 🐑.
A thread based on the Ministry of Health data with many graphs.
Let's dive!
👇👇👇
A thread based on the Ministry of Health data with many graphs.
Let's dive!
👇👇👇
Many of you heard about the decline of vaccine effectiveness in Israel in the past few months. The MoH publishes now on a daily basis the rate of infection in unvaxxed, vaxxed (2nd dose), and boosted individuals per 100K, which is a real treasure!
nature.com/articles/d4158…
nature.com/articles/d4158…
With this data, we can determine the **crude** VE of each group by dividing the rate of infection in second dosed individuals to unvaxxed. From Jan 2020 to now, this is the crude VE (crude = not adjusted to sex, age, and other demographic variables)
👇👇👇
👇👇👇

The small increase from Feb to March? The most likely explanation is that the older population was vaccinated first followed by younger individuals, where VE is better.
By mid-Mar, we virtually vaccinated everyone who wanted. Below: daily vaxxed (green: 2nd dose)
By mid-Mar, we virtually vaccinated everyone who wanted. Below: daily vaxxed (green: 2nd dose)

We enjoyed great protection in Mar-May. But then with the advent of Δ and waning immunity, the VE was in a free fall.
Why other countries don't see that?
1 🇮🇱 uses Pfizer, which wanes faster.
2 Everyone vaxxed in a short time period = easier to spot
3 3wk spacing between jabs.
Why other countries don't see that?
1 🇮🇱 uses Pfizer, which wanes faster.
2 Everyone vaxxed in a short time period = easier to spot
3 3wk spacing between jabs.
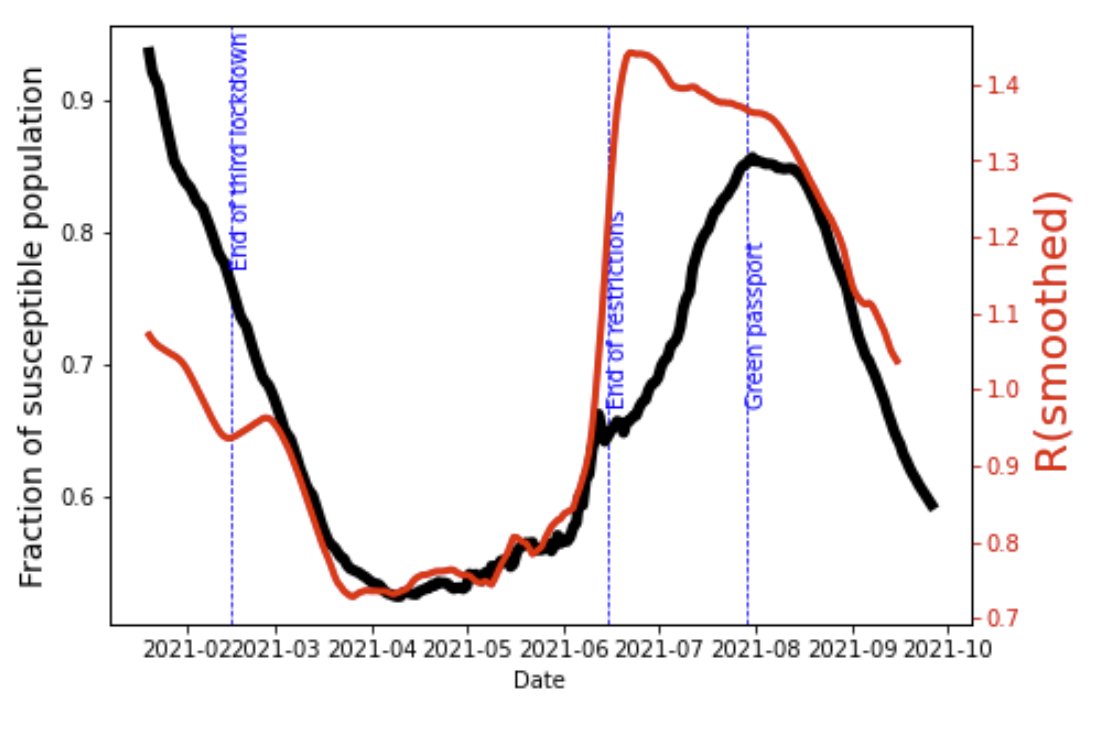
I wondered about the avg. susceptibility of the 🇮🇱population over time.
If no one vaxxed, it's 100% (we assume everyone is susceptible)
If everyone is vaxxed with a perfect vaccine, it's 0% (no one is susceptible).
Mathematically:
1-(VE x vaxxed)/pop_size.
👇👇👇
If no one vaxxed, it's 100% (we assume everyone is susceptible)
If everyone is vaxxed with a perfect vaccine, it's 0% (no one is susceptible).
Mathematically:
1-(VE x vaxxed)/pop_size.
👇👇👇

Technical note: to calculate the susceptibility level above, I used the crude VE of the 2nd dose AND the 3rd dose (Aug 1st) from the MoH.
Let's overly Re (red) on the susceptibility level (black). Look how nicely Re traces the susceptibility!
👇🔥🔥🔥
Let's overly Re (red) on the susceptibility level (black). Look how nicely Re traces the susceptibility!
👇🔥🔥🔥

You probably ask what about the anomaly in Feb-March and June. Easy! On 2/15, 🇮🇱 lifted the severe restrictions of the 3rd lockdown. R started to increase until hitting the immunity wall in Mar. On 6/15, 🇮🇱 lifted nearly all covid19 restrictions and put some back in July 29th.


So what could we learn from the susceptible-R dual graph?
The data **suggests** that with the current restrictions, we need to maintain the avg. susceptibility level to ~60% to maintain R<1. If the VE for infection is 60% after 5 months, we need to vaccinated 70% of the pop.
The data **suggests** that with the current restrictions, we need to maintain the avg. susceptibility level to ~60% to maintain R<1. If the VE for infection is 60% after 5 months, we need to vaccinated 70% of the pop.
Caveats
1 I didn't include in the analysis data on recovered individuals. It will probably reduce the level of vaccination to get R<1
2 Public data do not permit adjusting for demographic factors, so this is crude VE
3 smoothing => exp. window
4 data from:
datadashboard.health.gov.il/COVID-19/gener…
1 I didn't include in the analysis data on recovered individuals. It will probably reduce the level of vaccination to get R<1
2 Public data do not permit adjusting for demographic factors, so this is crude VE
3 smoothing => exp. window
4 data from:
datadashboard.health.gov.il/COVID-19/gener…
• • •
Missing some Tweet in this thread? You can try to
force a refresh