covid19 in ๐Ÿ‡ฎ๐Ÿ‡ฑ.

Due to โœก๏ธ holiday season, it is hard to get a reliable estimator of R. Previously, I showed that the avg susceptiblity of ISR population (S) is nicely correlated with R. This estimator is not affected by # test but only by # vaxxed and VE.
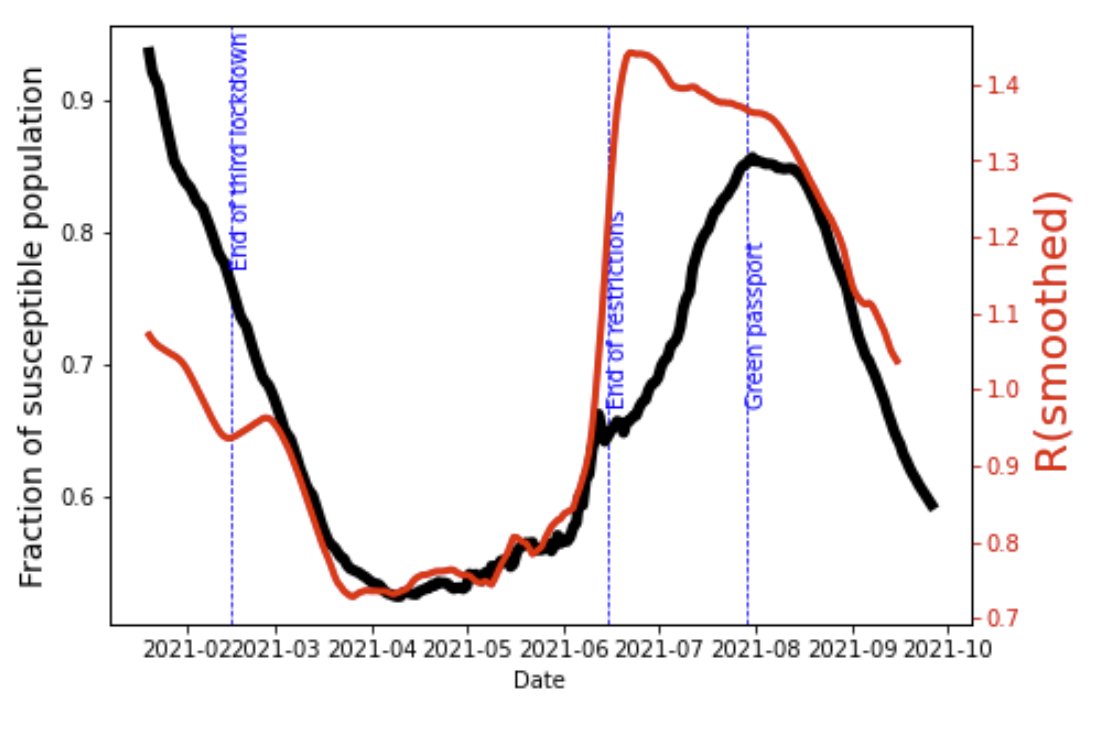
As a reminder, S(t), the susceptiblity of day t is 1 - ฮฃf_i(t) โ€ขVE_i(t). Where f_i(t) is the % of the population that already took the i-th dose and VE is the efficacy of the dose in day t. Both parameters can be in calculated from MoH public dashboard on a daily basis.
So...
So here is S as a func of time (black) versus smoothed R (red). Both are coorelated.

Now, we don't have good data for R in Sep, BUT due to booster, S is in levels similar to Mar 21 (60%)! At that time, it was enough for R=0.9, so I'm cautionally encouraged that we= heading out๐Ÿ˜
You can replicate this figure and play with the data in this github repo (GPLv3) :
github.com/erlich/covid19โ€ฆ

โ€ข โ€ข โ€ข

Missing some Tweet in this thread? You can try to force a refresh
ใ€€

Keep Current with Yaniv Erlich

Yaniv Erlich Profile picture

Stay in touch and get notified when new unrolls are available from this author!

Read all threads

This Thread may be Removed Anytime!

PDF

Twitter may remove this content at anytime! Save it as PDF for later use!

Try unrolling a thread yourself!

how to unroll video
  1. Follow @ThreadReaderApp to mention us!

  2. From a Twitter thread mention us with a keyword "unroll"
@threadreaderapp unroll

Practice here first or read more on our help page!

More from @erlichya

27 Sep
ืœืคื ื™ ื›ืฉื‘ื•ืขื™ื™ื ื”ืฆื’ืชื™ ืืช ืžื“ื“ ื” susceptibles.

ื”ืžื“ื“ (ืงื• ืฉื—ื•ืจ) ืžืฉืขืจืš ืืช % ื”ืื ืฉื™ื ืฉื—ืฉื•ืคื™ื ืœื”ื“ื‘ืงื” ื•ืฆื•ืคื” ืœื ืจืข ืฉืœ R (ืงื• ืื“ื•ื). ืื‘ืœ ื‘ื ื™ื’ื•ื“ ืœ R, ื”ื•ื ืœื ืชืœื•ื™ ื‘ื›ืžื•ืช ื”ื‘ื“ื™ืงื•ืช ืืœื ืจืง ื‘% ื”ืžื—ื•ืกื ื™ื ื•ื™ืขื™ืœื•ืช ื›ืœ ืžื ื” (ืžื“ื“ ื ืžื•ืš=ื˜ื•ื‘ ื™ื•ืชืจ).

ืื– ื”ืžื“ื“ (ืงื• ืฉื—ื•ืจ) ื”ื™ื•ื ื‘ืื•ืชื” ืจืžื” ืฉืœ 3/21, ื›ืœื•ืžืจ ืฆื•ืคื” R<1๐Ÿ˜ Image
ืขื•ื“ ืคืจื˜ื™ื: ื”ืžื“ื“ ืื•ืžืจ ืฉืื ืœื•ืงื—ื™ื ืืช ืื—ื•ื–ื™ ื”ืžืชื—ืกื ื™ื ื‘ื›ืœ ืžื ื” ื•ืืช ื”ื™ืขื™ืœื•ืช ืฉืœ ื”ืžื ื•ืช ื‘ื›ืžื” ื™ืžื™ื ื”ืื—ืจื•ื ื™ื, ื™ืฉ ื‘ืื•ื›ืœื•ืกื™ื” ืคื—ื•ืช ืž 60% ืื—ื•ื– ืื ืฉื™ื ืฉื—ืฉื•ืคื™ื ืœื”ื“ื‘ืงื”. ื‘ืžืจืฅ, ืขื ื”ื”ื’ื‘ืœื•ืช, ื–ื” ื”ืกืคื™ืง. ื”ื™ื•ื ื™ืฉ ื“ืœืชื ืžืฆื“ ืื‘ืœ ืขื•ื“ 300 ืืœืฃ ืžื—ืœื™ืžื™ื. ื‘ื–ื”ื™ืจื•ืช: ื ืจืื” ืฉืื ื• ืžืขื‘ืจ ืœืฉื™ื, ื›ืœ ื–ืžืŸ ืฉื™ืขื™ืœื•ืช ื”ื—ื™ืกื•ื ื™ื ืชืžืฉื™ืš.
ืขื•ื“ ืžืฉื”ื• ืžืขื ื™ื™ืŸ ื‘ืขื‘ื•ื“ื” ืขืœ ื”ืžื“ื“ ื”ื•ื ื™ืขื™ืœื•ืช ืžื ื” 2 ื ื’ื“ ืชื—ืœื•ืื”. ืฉืžื• ืœื‘ ืœืฉื™ืคื•ืจ ื‘ืื•ื’ืณ. ื”ืฉื™ืคื•ืจ ื ื•ื‘ืข ื›ื›ื”ืดื  ืฉืžื™ ืฉื”ืชื—ืกืŸ ื‘ืžื ื” 3, ื”ื™ื• ื‘ื“ื™ื•ืง ืืœื” ืฉื”ื™ื• ื”ื›ื™ ื–ืงื•ืงื™ื ืœื›ืš: ืžื‘ื•ื’ืจื™ื ืขื ืžื ื” 2 ื‘ื™ืขื™ืœื•ืช ืืคืกื™ืช. ื‘ืจื’ืข ืฉื”ื ื™ืฆืื• ืžื”ืžื“ื’ื, ื ืฉืืจื ื• ืขื ืฆืขื™ืจื™ื ื‘ื™ืขื™ืœื•ืช ืžืฉื•ืคืจืช (ืื‘ืœ ืขื“ื™ื™ืŸ ืจื—ื•ืงื” ืžืœื”ื™ื•ืช ื˜ื•ื‘ื” ื›ืžื• ื‘ื”ืชื—ืœื”). Image
Read 4 tweets
16 Sep
Israel ๐Ÿ‡ฎ๐Ÿ‡ฑ, booster ๐Ÿ’‰๐Ÿ’‰๐Ÿ’‰, and herd immunity ๐Ÿ‘.
A thread based on the Ministry of Health data with many graphs.
Let's dive!
๐Ÿ‘‡๐Ÿ‘‡๐Ÿ‘‡
Many of you heard about the decline of vaccine effectiveness in Israel in the past few months. The MoH publishes now on a daily basis the rate of infection in unvaxxed, vaxxed (2nd dose), and boosted individuals per 100K, which is a real treasure!
nature.com/articles/d4158โ€ฆ
With this data, we can determine the **crude** VE of each group by dividing the rate of infection in second dosed individuals to unvaxxed. From Jan 2020 to now, this is the crude VE (crude = not adjusted to sex, age, and other demographic variables)
๐Ÿ‘‡๐Ÿ‘‡๐Ÿ‘‡ Image
Read 10 tweets
15 Sep
ืฉืจืฉื•ืจ ืขืœ ื—ืกื™ื ื•ืช ื”ืื•ื›ืœื•ืกื™ื” ื‘ื™ืฉืจืืœ ื•ื”ืชืคืฉื˜ื•ืช ื”ืชื—ืœื•ืื”. ืื™ืคื” ื”ื™ื™ื ื• ื•ืœืืŸ ืื ื—ื ื• ื”ื•ืœื›ื™ื.
ื™ื”ื™ื” ื’ืจืคื™ื ๐Ÿ“Š. ื•ื™ื”ื™ื” ืžืขื ื™ื™ืŸ!
๐Ÿงต๐Ÿ‘‡๐Ÿง
ืขื ื”ื“ืื˜ื” ื‘ื“ืืฉื‘ื•ืจื“ ืืคืฉืจ ืขื›ืฉื™ื• ืœื—ืฉื‘ ื‘ื›ืœ ื™ื•ื ื”ื—ืœ ืžื™ื ื•ืืจ ืืช ื™ืขื™ืœื•ืช ื”ื’ื•ืœืžื™ืช ืฉืœ ืžื ื” 2 ืœืขื•ืžืช ืœื ืžื—ื•ืกื ื™ื. ืžื” ืื ื—ื ื• ืจื•ืื™ื ื›ืืŸ ื‘ืขืฆื? ื–ื” ืคืฉื•ื˜ ื™ื—ืก ื”ืžืื•ืžืชื™ื ื‘ื™ืŸ ืžื—ื•ืกื ื™ื 2 ืœืœื ืžื—ื•ืกื ื™ื ื‘ื›ืœ ื™ื•ื ืœืื—ืจ ื ื™ืจื•ืžื•ืœ ืœื’ื•ื“ืœ ื”ืื•ื›ืœื•ืกื™ื”. ื–ืืช ื™ืขื™ืœื•ืช ื’ื•ืœืžื™ืช ื›ื™ ื”ื™ื ืœื ืžืชืงื•ื ื ืช ืœืžื’ื–ืจ ืื• ื’ื™ืœ (ืื‘ืœ ืœืื—ืจ ื”ื—ืœืงื”).
ืฉื™ืžื• ืœื‘ ืœืขืœื™ื” ื”ืงื˜ื ื” ื‘ื™ืขื™ืœื•ืช ื‘ืื–ื•ืจ ืชื—ื™ืœืช ืžืจืฅ. ืื ื™ ืžื ื™ื— ืฉื–ื” ื ื’ืจื ื›ืชื•ืฆืื” ืžื”ืชื—ืกื ื•ืช ื”ืื•ื›ืœื•ืกื™ื” ื”ื™ื•ืชืจ ืฆืขื™ืจื” ื‘ืกื•ืฃ ื™ื ื•ืืจ, ืฉืฉื ื”ื—ื™ืกื•ืŸ ื™ืขื™ืœ ื™ื•ืชืจ ืžืืฉืจ ื‘ืื•ื›ืœื•ืกื™ื” ื”ืžื‘ื•ื’ืจืช.
ืกื‘ื™ื‘ ื”ื—ืฆื™ ื”ืจืืฉื•ืŸ ืฉืœ ื—ื•ื“ืฉ ืืคืจื™ืœ ื”ืงืกื•ื, ืœืžืชื—ืกืŸ ื”ืžืžื•ืฆืข ื”ื™ื” ื™ืขื™ืœื•ืช ื’ื‘ื•ื”ื” ืžืื“. ื•ืื– ื”ื—ืœื” ื”ืฉื—ื™ืงื” ืฉื”ื‘ื™ืื” ืœื ืคื™ืœื” ื—ื•ืคืฉื™ืช ื‘ืžืื™-ื™ื•ื ื™.
Read 10 tweets
7 Sep
Important data from Israel: the relative protection against contracting Covid19 at the 4th wave as a function of vax/prior reinfection status. The data is calibrated to RR=1 for people who received 2nd dose in Jan and no booster.

A few thoughts below on waning protection๐Ÿ‘‡
One important take away is that a prior infection protects you but can wane without a vax. People who contracted covid during the 2nd wave (Sep-Oct 20; dark red) have 1.9x risk to get delta compared to people who contracted Covid during the 3d wave (Jan-Feb 21; light red).
Recall that Alpha (3rd wave) is not closer to Delta (4th wave) than the ancestral strain (2nd wave). So it is reasonable to assume that diff are due to waning immunity.

This means that a recovered person looses ~15% of the protection per month. After 2yrs =~ no protection.
Read 7 tweets
19 Aug
The Israeli MoH released some results about the effectiveness of the booster to tame infection rate.
Behavior or immunity or both?

A short technical thread with interesting results.
๐Ÿงต๐Ÿงต๐Ÿงต
Israel does not conduct an RCT for the third dose. Thus, the main analysis for booster-VE is comparing the cases in boosted vs 2nd dosed as a proxy for increased protection. But boosted individuals might be โฌ†๏ธcovid19-worried, leading to lower โฌ‡๏ธexposure.
To mitigate that, the MoH adjusted for basic demography and calendar day of infection and reported the graph below. Y-axis: Booster vs 2nd dose fold protection as a function of days from booster.
But there is something weird...๐Ÿง
Read 8 tweets
19 Aug
Interesting data about the performance of boosted as a function of time. Y: protection compared to 2 doses. X: days from booster.

There is an increase in protection with time after day 7. This reduces the chance of a behavioral effect (but not completely mitigate it) Image
These results are more puzzling. From right to left: days, # cases, # severe. Top line ๐Ÿ’‰๐Ÿ’‰. Bottom: ๐Ÿ’‰๐Ÿ’‰๐Ÿ’‰ >10days Image
Why puzzling? Because rate of (boosted severe/)(boosted cases) is ~5%. We saw a similar rate earlier in with only 2nd dose. Don't know how to explain that. Image
Read 4 tweets

Did Thread Reader help you today?

Support us! We are indie developers!


This site is made by just two indie developers on a laptop doing marketing, support and development! Read more about the story.

Become a Premium Member ($3/month or $30/year) and get exclusive features!

Become Premium

Too expensive? Make a small donation by buying us coffee ($5) or help with server cost ($10)

Donate via Paypal Become our Patreon

Thank you for your support!

Follow Us on Twitter!

:(