I find myself always tweeting bearish tweets (😂), but is just the market conditions that I see.
So I found a bullish setup in $XLM
As always, this method works well on any crypto from $BTC, $ETH, $SOL, $AXS, $XTZ, $COMP, (tags for reach!)
Using the @Bybit_Official chart
So I found a bullish setup in $XLM
As always, this method works well on any crypto from $BTC, $ETH, $SOL, $AXS, $XTZ, $COMP, (tags for reach!)
Using the @Bybit_Official chart

Righto - let's get this going.
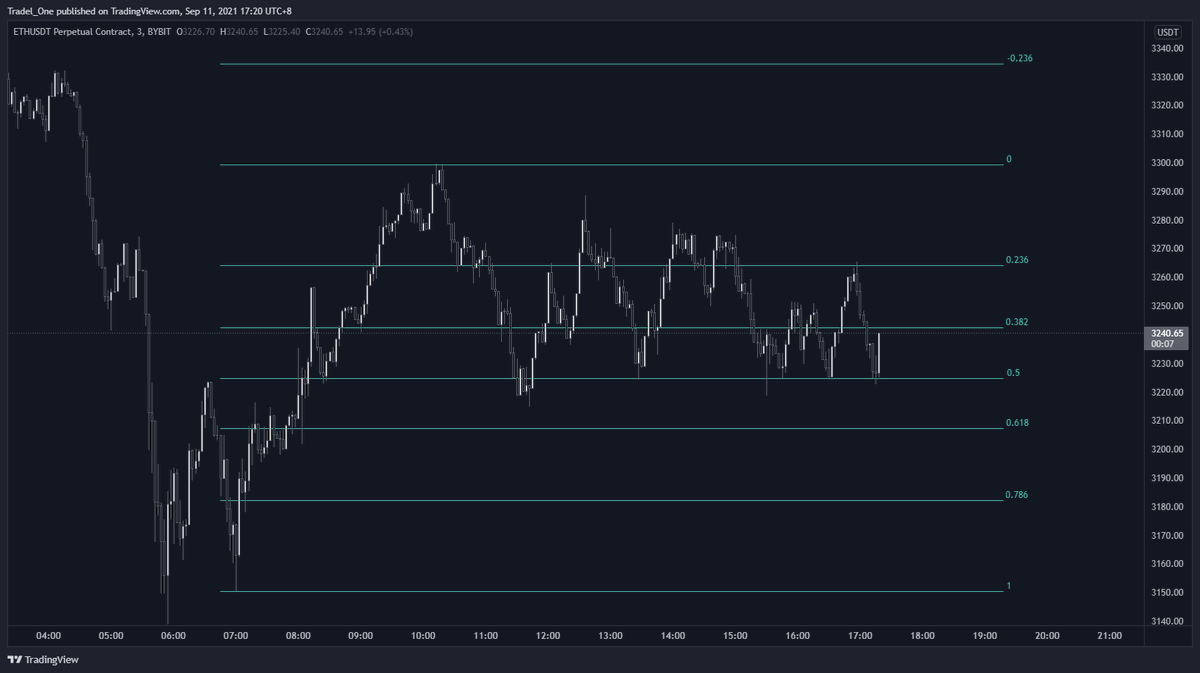
Pull your fibs on the HTF 1H.
The reason I've selected these points is that they are relative to the local move itself rather than the sharp drop in price previously
We're now trading at the 0.236 key level
Pull your fibs on the HTF 1H.
The reason I've selected these points is that they are relative to the local move itself rather than the sharp drop in price previously
We're now trading at the 0.236 key level

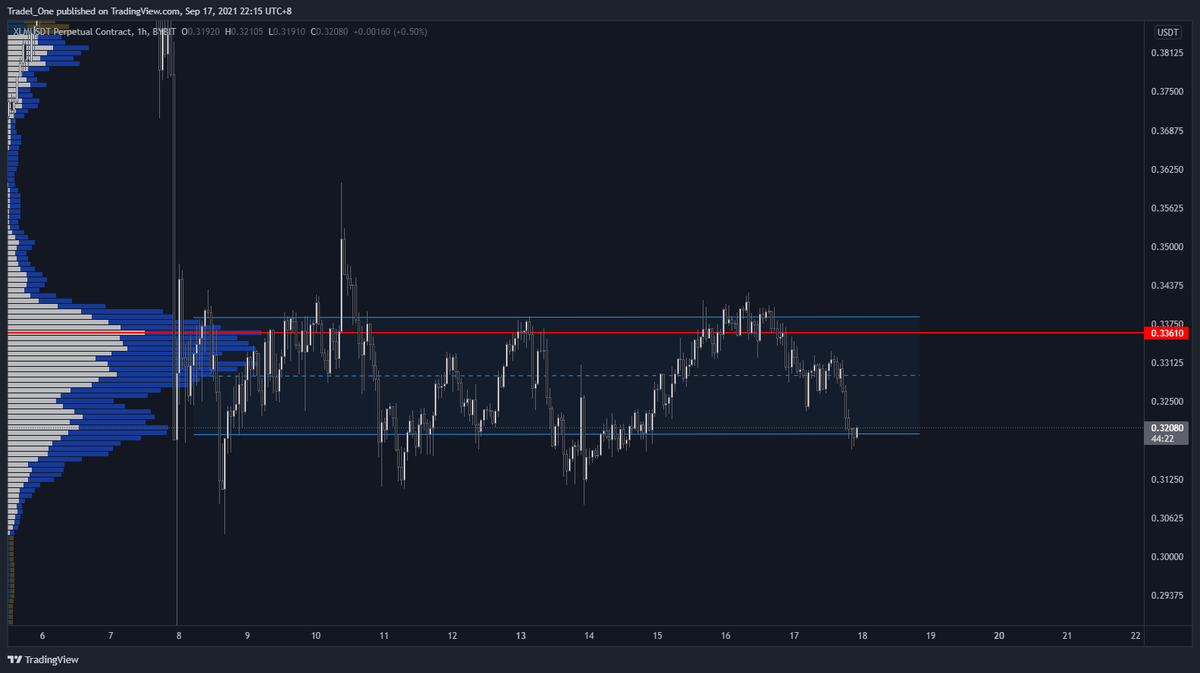
I've thrown on the Fixed Range Volume Profile tool that is available for free on @tradingview
You just pull this from A to B of where you want to explore volume.
The red and white bars give you the value area of a move. This is where 70% of the volume has traded in this area.
You just pull this from A to B of where you want to explore volume.
The red and white bars give you the value area of a move. This is where 70% of the volume has traded in this area.

You're also given a Point of Control as well with the tool, which is where the most volume occured within this 70% selected area.
The Value Area is shown in the white rectangle in the above tweet.
The Point of Control gives good resistance and support generally.
The Value Area is shown in the white rectangle in the above tweet.
The Point of Control gives good resistance and support generally.
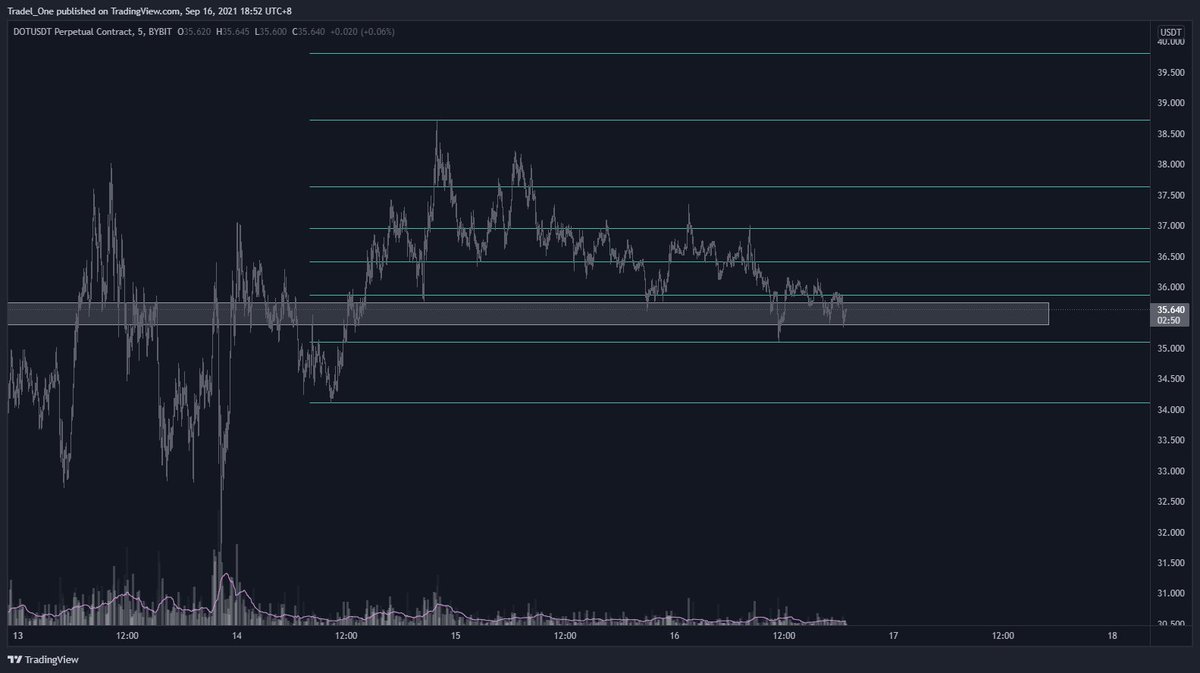
Now what we've done is effed off the FRVP (red and white bars) and have now lined up a parallel channel to trade to
You place the channel at the most suitable areas given the market structure presented to you.
It's flexible in interpretation.
You place the channel at the most suitable areas given the market structure presented to you.
It's flexible in interpretation.

You usually long the bottom of a channel and then short the top, taking profits entirely or partially at the mid point
It's all about confluence baby, so let's throw some more fibs down.
We find price trading at the 0.705 of the overall move here as well as being at the bottom of a channel, and at the 0.236 level of the HTF fibs we had on before (not shown for clarity)
We find price trading at the 0.705 of the overall move here as well as being at the bottom of a channel, and at the 0.236 level of the HTF fibs we had on before (not shown for clarity)

But... what else was residing at the bottom of the channel?
Eff me dead, it's a naked point of control that's now been claimed by price action.
See how we're building a picture now?
Eff me dead, it's a naked point of control that's now been claimed by price action.
See how we're building a picture now?

Nearly there.
Let's also throw on the VPVR and see what this is showing.
Point of control and similar Value Area (well, let's be honest, we didn't zoom out much further, so didn't expect it to be too different)
Let's also throw on the VPVR and see what this is showing.
Point of control and similar Value Area (well, let's be honest, we didn't zoom out much further, so didn't expect it to be too different)
So for me, this is a long confirmed.
Entry?
- Bottom of channel
Exit?
- Point of Control / Top of Channel
Take Profits?
- Mid channel / Top of Channel
One more thing:
When pulling fibs from swing high to low, we also find some resisting confluence at our level of 0.705
Entry?
- Bottom of channel
Exit?
- Point of Control / Top of Channel
Take Profits?
- Mid channel / Top of Channel
One more thing:
When pulling fibs from swing high to low, we also find some resisting confluence at our level of 0.705

This will work until is doesn't.
Ie channel bashing is great until your short fails or your long does, but if you catch a few trades along the way, then it shouldn't matter if you're risking 1% at a time right?
Risk management is key.
Thanks for reading.
🤝🍻
Ie channel bashing is great until your short fails or your long does, but if you catch a few trades along the way, then it shouldn't matter if you're risking 1% at a time right?
Risk management is key.
Thanks for reading.
🤝🍻
• • •
Missing some Tweet in this thread? You can try to
force a refresh