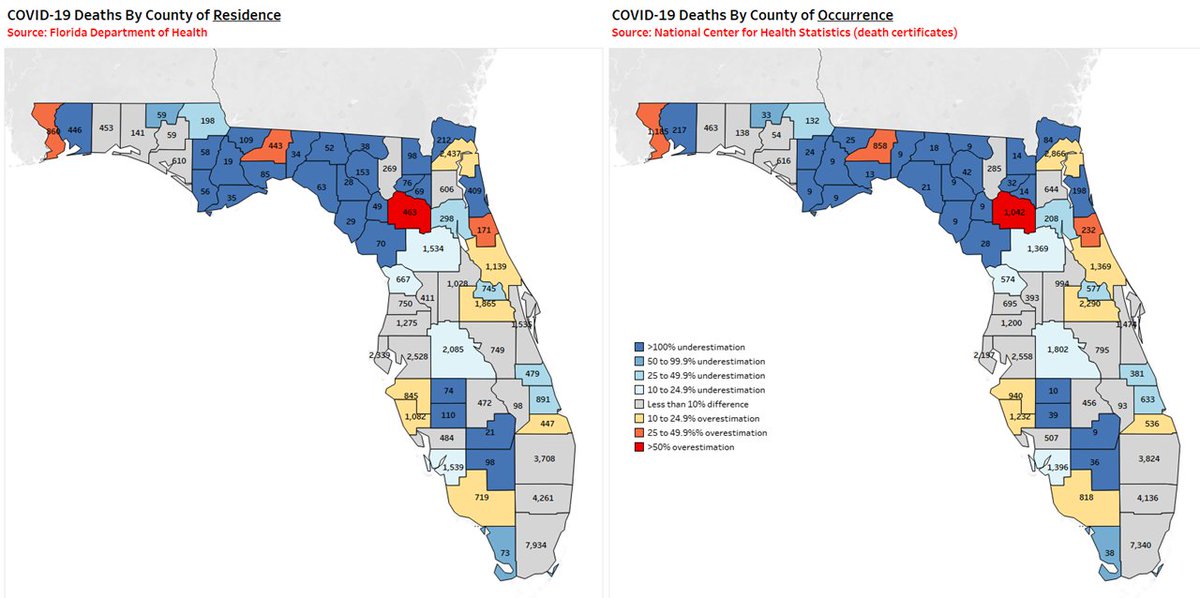
County-level #COVID19 deaths in #Florida
A cautionary tale about comparisons: data sources matter!
Much attention recently paid to county-level COVID-19 death data being made available again in FL...thru the federal "Community Profile Report".
healthdata.gov/Health/COVID-1…
1/
A cautionary tale about comparisons: data sources matter!
Much attention recently paid to county-level COVID-19 death data being made available again in FL...thru the federal "Community Profile Report".
healthdata.gov/Health/COVID-1…
1/
But near-current county-level #COVID19 deaths in #Florida (and throughout the country) has long been available through the National Center for Health Statistics at @CDCgov.
Link below.
2/
data.cdc.gov/NCHS/Provision…
Link below.
2/
data.cdc.gov/NCHS/Provision…
People have already pointed to differences between these data sources as further "evidence" that @HealthyFla is getting something wrong or hiding something.
Others have used both data sources to calculate rates and compare counties on their cumulative COVID-19 mortality.
3/
Others have used both data sources to calculate rates and compare counties on their cumulative COVID-19 mortality.
3/
BUT, despite capturing the same surface-level metrics (county-level #COVID19 deaths), they are VERY different.
FIRST, the definitions of a COVID-19 death are different.
The NCHS data (figure below) are based on the U07.1 code as a cause of death on the death certificate.
4/
FIRST, the definitions of a COVID-19 death are different.
The NCHS data (figure below) are based on the U07.1 code as a cause of death on the death certificate.
4/

The @HealthyFla data are based on the definition implemented by the state (figure below).
Although the two definitions should yield similar numbers, they are [clearly] not identical.
5/
Although the two definitions should yield similar numbers, they are [clearly] not identical.
5/

But the bigger difference is what the COUNTY variable means.
In the NCHS data, the location (state and county) are based on where the person died (county of OCCURRENCE), not the county of which they were a resident.
The verification and "why" are below (from NCHS):
6/
In the NCHS data, the location (state and county) are based on where the person died (county of OCCURRENCE), not the county of which they were a resident.
The verification and "why" are below (from NCHS):
6/

In contrast, the county being reported from @HealthyFla, and presented in the "Community Profile Report", is the decedent's county of RESIDENCE.
But, a logical question people may ask is, "Does it really make a difference?"
I'll let you decide (but, the answer is YES)
7/
But, a logical question people may ask is, "Does it really make a difference?"
I'll let you decide (but, the answer is YES)
7/
I looked at the cumulative # of #COVID19 deaths, by county, reported through the 3rd wk in Sep.
I did this in both data sources - county of residence (L) & occurrence (R).
For counties with suppressed death counts from NCHS, I assumed 9, the highest # that is suppressed.
8/
I did this in both data sources - county of residence (L) & occurrence (R).
For counties with suppressed death counts from NCHS, I assumed 9, the highest # that is suppressed.
8/

Counties are shaded by the difference in counts/rates conferred by using county of occurrence vs. residence.
Look at Alachua
- 463 based on residence
- 1,042 based on occurrence
Look at Leon
- 443 based on residence
- 858 based on occurrence
9/
Look at Alachua
- 463 based on residence
- 1,042 based on occurrence
Look at Leon
- 443 based on residence
- 858 based on occurrence
9/

Look at St. John's
- 409 based on residence
- 198 based on occurrence
Look at Baker
- 98 based on residence
- 14 based on occurrence
What's going on?
10/
- 409 based on residence
- 198 based on occurrence
Look at Baker
- 98 based on residence
- 14 based on occurrence
What's going on?
10/

The map on the left shows hospitals in the state.
I've drawn arrows to show that residents of smaller counties, especially in the north/panhandle, tend to go to hospitals in Escambia, Leon, Alachua, and Duval when they get sick with #COVID19.
11/
I've drawn arrows to show that residents of smaller counties, especially in the north/panhandle, tend to go to hospitals in Escambia, Leon, Alachua, and Duval when they get sick with #COVID19.
11/

If a patient dies where (s)he receives care (many #COVID19 deaths occur in hospitals), and where (s)he received care is in a different county from their county of residence, that's how we get the discrepancy.
12/
12/
So, for smaller counties, you tend to have deaths by county of occurrence UNDERESTIMATE true mortality based on county of residence.
And for larger counties with healthcare facilities that serve these smaller counties - you tend to have OVERESTIMATION.
13/
And for larger counties with healthcare facilities that serve these smaller counties - you tend to have OVERESTIMATION.
13/
So, which should you use for calculation of #COVID19 mortality rates?
- COUNTY OF RESIDENCE -
The denominators we use to calculate rates are based on county of residence, so using a county of occurrence death file to calculate rates would be misleading for many counties.
14/
- COUNTY OF RESIDENCE -
The denominators we use to calculate rates are based on county of residence, so using a county of occurrence death file to calculate rates would be misleading for many counties.
14/
This is, in part, why I choose not to present county-level new hospital admission rates on my dashboard. I only present state level.
It's because the admissions data is based on facility of care, not county of residence for the patient.
15/
covid19florida.mystrikingly.com
It's because the admissions data is based on facility of care, not county of residence for the patient.
15/
covid19florida.mystrikingly.com
So, to recap.
1. These datasets are presenting different things. No errors, no hiding info, just different.
2. Be cautious which source you use depending on your analytic goal. Both can be nice to compare/contrast.
3. Both datasets are underestimating very recent deaths.
16/
1. These datasets are presenting different things. No errors, no hiding info, just different.
2. Be cautious which source you use depending on your analytic goal. Both can be nice to compare/contrast.
3. Both datasets are underestimating very recent deaths.
16/
4. Be careful when comparing mortality rates in counties with different age strata. We do not get deaths stratified by both county of residence and age in Florida (as far as I know), so age-adjustment is not possible to improve county-level comparisons.
17/
17/
That's all - I receive a lot of questions about county-level differences (e.g., people freaking out about Alachua County when unknowingly using a "county of occurrence" dataset).
Thought I would address some basic aspects of these data in this 🧵
Cheers!
18/🏁
Thought I would address some basic aspects of these data in this 🧵
Cheers!
18/🏁
• • •
Missing some Tweet in this thread? You can try to
force a refresh


