Re: Testing positivity rates in NSW / VIC / ACT

Testing in NSW is falling - but so is the positivity rate

3 weeks ago, NSW was testing ~130,000 ppl/day. Positivity reached 1.1%

Today, NSW testing just under 120,000 / day.* Positivity: 0.83%

#covid19aus #covid19nsw #COVID19Vic Image
*I calculate the positivity rate by:
% = 7-day avg tests / 7-day avg cases

I think this smoothed rate is slightly more reliable than a daily rate

It shows the trend and eliminates factors like daily volatility, weekend effect, possibly mismatched numerators/denominators
The downside of this smoothed rate is it can be slow to show what's happening

But IMO, that's more of a concern when the positivity rate is rising, rather than falling

Here, the grey line shows the positivity rate in ACT (now 0.7%) Image
But the one to watch most of all is VIC, with 1.3% and rising (blue line) Image
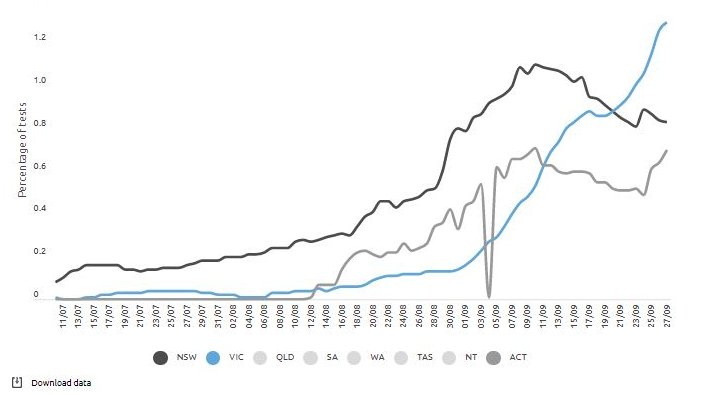
That said, the positivity rate in VIC is still a lot better than it was last year (reached 2.67% using the same method of calculation) Image
The impact of surveillance testing in NSW is unclear. Even though NSW Health scrapped its mandatory testing because of pressures on labs, there's still plenty of surveillance testing going on
Live charts at the bottom of this page:
covid19data.com.au/testing

• • •

Missing some Tweet in this thread? You can try to force a refresh
 

Keep Current with Juliette O'Brien

Juliette O'Brien Profile picture

Stay in touch and get notified when new unrolls are available from this author!

Read all threads

This Thread may be Removed Anytime!

PDF

Twitter may remove this content at anytime! Save it as PDF for later use!

Try unrolling a thread yourself!

how to unroll video
  1. Follow @ThreadReaderApp to mention us!

  2. From a Twitter thread mention us with a keyword "unroll"
@threadreaderapp unroll

Practice here first or read more on our help page!

More from @juliette_io

28 Sep
NSW LGA monster wrap 👻

NSW as 3 different outbreaks - How do cases in the last 14 days compare with previous 14 days?

1. Southwest/Western Sydney: -34%
2. Rest of Greater Sydney: +14%
3. Regional NSW: +48%

LGA details below 👇

#covid19nsw #covid19aus
1. SW/W ...

📍 Western Sydney: +189=3826 (-39%) 🥳

Blacktown: +56 = 1450 (-26%)
Cumberland: +64 = 1389 (-51%)
Parramatta: +22 = 377 (-38%)
Penrith: +47 = 610 (-30%)

*How to read the data: +Cases today = Last 14 days (14-day change %)
📍 Southwest Sydney: +244=5184 (-29%) 🥳

Camden: +8 = 287 (10%)
Campbelltown: +45 = 607 (-1%)
Canterbury-Bankstown: +101 = 2184 (-39%)
Fairfield: +34 = 776 (-30%)
Liverpool: +56 = 1330 (-25%)
Read 18 tweets
26 Sep
NSW LGA monster wrap👻

NSW as 3 different outbreaks: How do cases in the last 14 days compare with previous 14 days?

1. SW/W: -29% (daily cases shrinking)
2. Rest of Greater Syd: +25% (daily cases growing)
3. Regional NSW: +24% (daily cases growing)

#covid19nsw #covid19aus
Where daily cases are growing, is growth getting faster or slower?

Rest of Greater Sydney: Slower

14-day % change over the last week ...
+101%
+94%
+81%
+70%
+59%
+47%
+36%
+25%
Regional NSW: Faster

14-day % change over the last week ...
+2%
-3%
+2%
+2%
+4%
+14%
+18%
+24%
Read 17 tweets
25 Sep
🔵 VIC LGA monster 👻 wrap

Looking at VIC as 3 different outbreaks -

North/West: +679=6497 (🔺164%)
Rest of metro: +121=1090 (🔺237%)
Regional VIC: +29=163 (🔺87%)

Data key:
+ Cases today = 14-day sum (14-day change %)

covid19data.com.au/victoria-lgas-…

#covid19vic #covid19aus
📍 North/West

Brimbank: +56=354 (105%) 👀
Darebin: +29=241 (39%)
Hobsons Bay: +11=195 (-11%) 👍
Hume: +337=2839 (40%) 👀
Maribyrnong: +2=48 (29%)
Melton: +44=300 (75%)
Moonee Valley: +18=187 (43%)
Moreland: +49=762 (-12%) 👍
Whittlesea: +74=783 (54%)
Wyndham: +32=580 (16%)
📍 Rest of Metro

Banyule:+12=126 (150%) 👀
Bayside:+4=22 (114%)
Boroondara:+4=20 (200%)
Casey:+27=208 (93%) 👀
Cardinia:+6=93 (265%)
Frankston:+7=24 (600%)
Glen Eira:+0=45 (50%)
Greater Dandenong:+10=101 (35%)
Kingston:+4=39 (357%)
Knox:+4=37 (417%)
Latrobe:+3=4 (200%)
Read 7 tweets
25 Sep
Vaccine leaderboards

First doses -
🇦🇺 Australia: 75.4% (+0.6%)

ACT: 85.9% (+0.9%) (👇 more on this below )
NSW: 85.2% (+0.5%)
VIC: 76.9% (+0.6%)
TAS: 74.3% (+0.6%)
SA: 65.6% (+0.5%)
NT: 64.9% (+0.4%)
QLD: 63.4% (+1.2%)
WA: 63.0% (+0.6%)

1/5

#covid19aus #COVID19Vic #COVID19nsw
Full vax -
🇦🇺 Australia: 50.9% (+0.8%)

ACT: 60.3% (+0.8%)
NSW: 59.2% (+1.4%)
TAS: 55.7% (+0.6%)
NT: 50.7% (+0.7%)
SA: 47.1% (+0.6%)
VIC: 47.0% (+0.4%)
WA: 44.5% (+0.6%)
QLD: 44.5% (+0.5%)

2/5
NSW recently overtook ACT on the first dose leaderboard but lost that lead today

See how ACT is still charging ahead with first doses. They burst through 80% and no sign of slowing yet

Whereas ...

3/5 Image
Read 6 tweets
24 Sep
⚫️ NSW LGAs monster wrap 👻

State summary -

Southwest / West Sydney: +601 = 11,102 ( -17%)👍
Rest of Greater Sydney: +370 = 4,965 (🔺59%)
Regional NSW: +79 = 779 (🔺5%)

Data key:
+ Cases today = 14-day sum (+/- 14-day change %)

covid19data.com.au/nsw-lgas-cases
#covid19nsw #covid19aus Image
1. Southwest / West Sydney -

📍 Western Sydney: +261=4739 (-27%) 👌
Cumberland: +87 = 1831 (-42%) 👏☝️
Parramatta: +30 = 451 (-27%)
Penrith: +46 = 684 (-21%)
Blacktown: +98 = 1770 (-5%) 👇 Image
📍 Southwest Sydney: +340=6363 (-8%) 👍
Camden: +12 = 314 (23%)
Campbelltown: +46 = 648 (14%)
Canterbury-Bankstown: +123 = 2821 (-20%) 👇
Fairfield: +54 = 887 (-18%)
Liverpool: +105 = 1692 (14%) Image
Read 13 tweets
24 Sep
🔵 VIC LGAs monster wrap 👻

Summary -

North-West: +549=6202 (🔺192%)
Rest of Metro: +135=1002 (🔺246%)
Regional VIC: +26=145 (🔺67%)

Data key: +Net cases today = 14-day sum (+/- 14-day change %)

covid19data.com.au/victoria-lgas-…
#covid19vic #covid19aus
(Chart: Hume 👇) Image
📍 North-West LGAs -

Brimbank: +34=317 (64%)
Darebin +24=233 (22%)
Hobsons Bay: +21=198 (4%)
Hume: +237=2667 (31%) 👀
Maribyrnong: +5=48 (53%)
Melton: +31=263 (68%)
Moonee Valley: +27=177 (33%)
Moreland: +42=798 (-18%) 👍
Whittlesea: +68=748 (56%) 👇
Wyndham: +38=570 (32%) Image
📍 Rest of Metro -

Banyule :+21=118 (147%)
Bayside :+0=18 (400%)
Boroondara :+4=16 (200%)
Casey :+22=183 (65%) 👇
Cardinia :+9=88 (318%)
Frankston :+5=19 (275%)
Glen Eira :+5=43 (87%)
Greater Dandenong :+7=96 (40%)
Kingston :+4=35 (300%)
Knox :+10=34 (367%)
Latrobe :+0=1 (-100%) Image
Read 7 tweets

Did Thread Reader help you today?

Support us! We are indie developers!


This site is made by just two indie developers on a laptop doing marketing, support and development! Read more about the story.

Become a Premium Member ($3/month or $30/year) and get exclusive features!

Become Premium

Too expensive? Make a small donation by buying us coffee ($5) or help with server cost ($10)

Donate via Paypal Become our Patreon

Thank you for your support!

Follow Us on Twitter!

:(