🚨 Does #Covid19 Vaccination lead to less COVID-19-Like Illness (CLI)?
A test-negative design study with 41,552 participants looked CLI diagnosis, symptomatic illness, and test positivity by vaccination status.
⬇️ Megathread below... ⬇️ Like & RT 🚨
#Covid #Corona #Coronavirus
A test-negative design study with 41,552 participants looked CLI diagnosis, symptomatic illness, and test positivity by vaccination status.
⬇️ Megathread below... ⬇️ Like & RT 🚨
#Covid #Corona #Coronavirus
Let's start from the beginning!
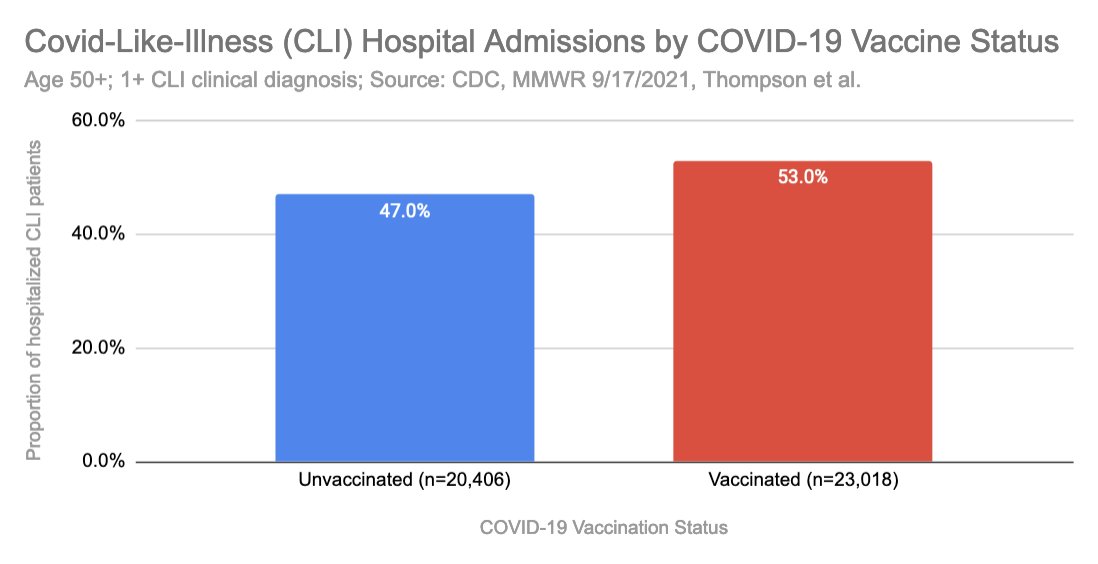
A recent study by Thompson et al., which was published in the @NEJM, funded and features by @CDCgov in its weekly MMWR series, looked at COVID-19 Like Illness (CLI) hospitalizations for the age group 50+.
A recent study by Thompson et al., which was published in the @NEJM, funded and features by @CDCgov in its weekly MMWR series, looked at COVID-19 Like Illness (CLI) hospitalizations for the age group 50+.

The study authors identified over 40k hospitalizations.
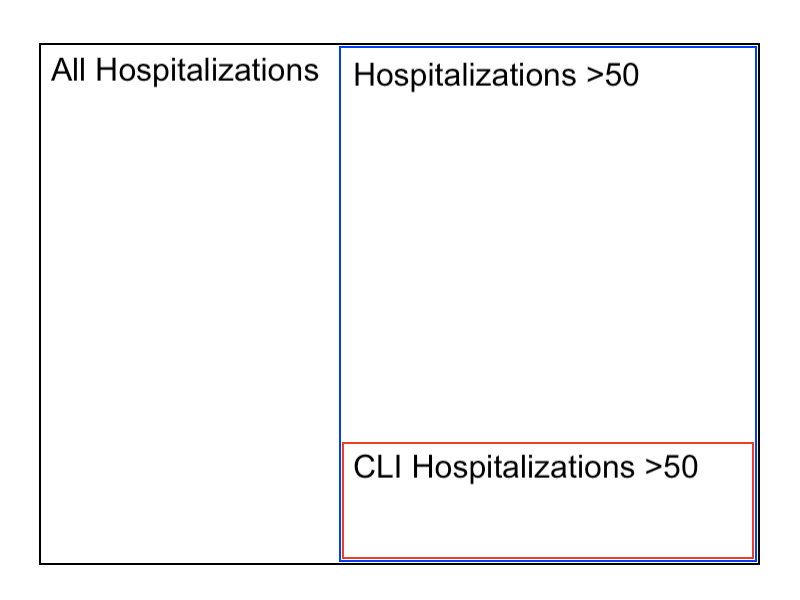
These were not all-cause hospitalizations, but CLI diagnosed hospitalizations, which is a subset of all hospitalizations. Time frame: 1/1/21 - 6/22/21.
The below diagram tries to visualize the study sample (red).
These were not all-cause hospitalizations, but CLI diagnosed hospitalizations, which is a subset of all hospitalizations. Time frame: 1/1/21 - 6/22/21.
The below diagram tries to visualize the study sample (red).
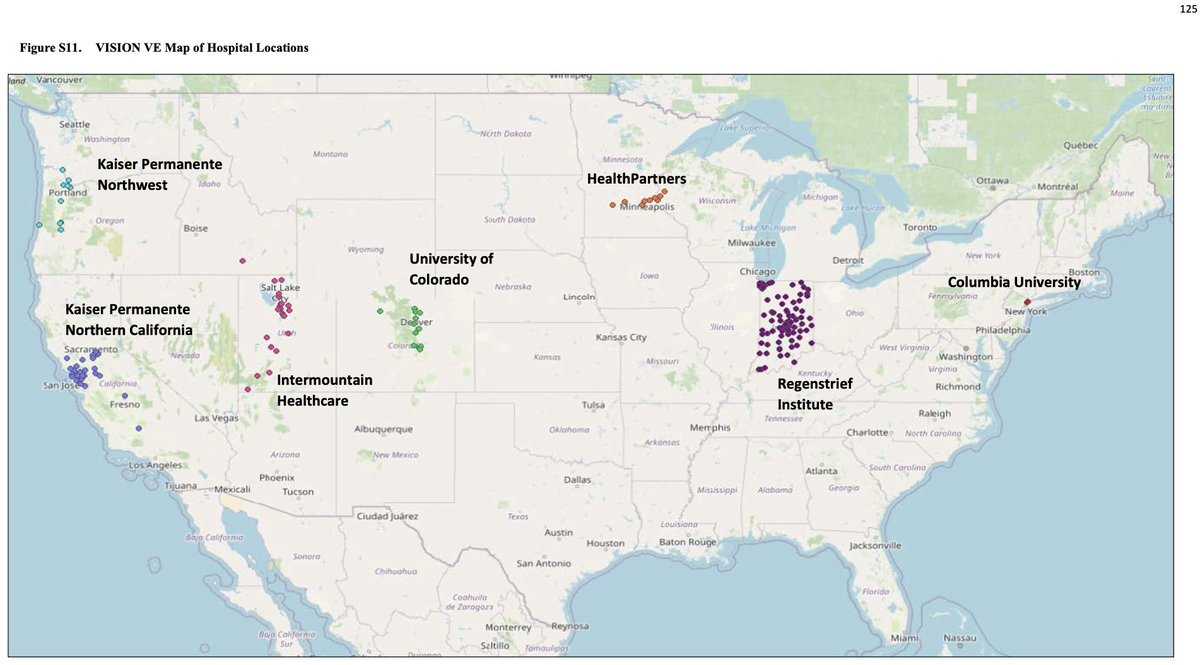
They gathered 103,199 hospitalizations from 7 diff. locations, see map.
They used a test-negative study design, means that they included everyone that matched the criteria (50+ & CLI diagnosis).
They used a test-negative study design, means that they included everyone that matched the criteria (50+ & CLI diagnosis).
This is not ideal, since it’s still not all-cause hospitalization by vaccine status, but it’s much better than what we’ve seen before.
And it should be representative within it's sample.
And it should be representative within it's sample.
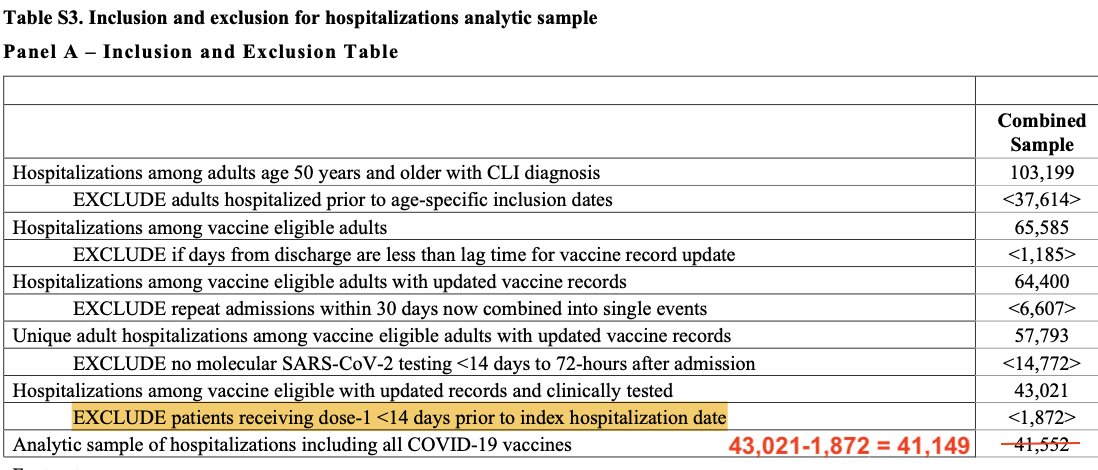
It is noteworthy, that they excluded 61,647 hospitalizations, that did not match their study criteria:
1) <50
2) No vaxx records
3) Repeat admissions
4) No covid19 testing
5) Recently Vaxxed (<14d)
1) <50
2) No vaxx records
3) Repeat admissions
4) No covid19 testing
5) Recently Vaxxed (<14d)
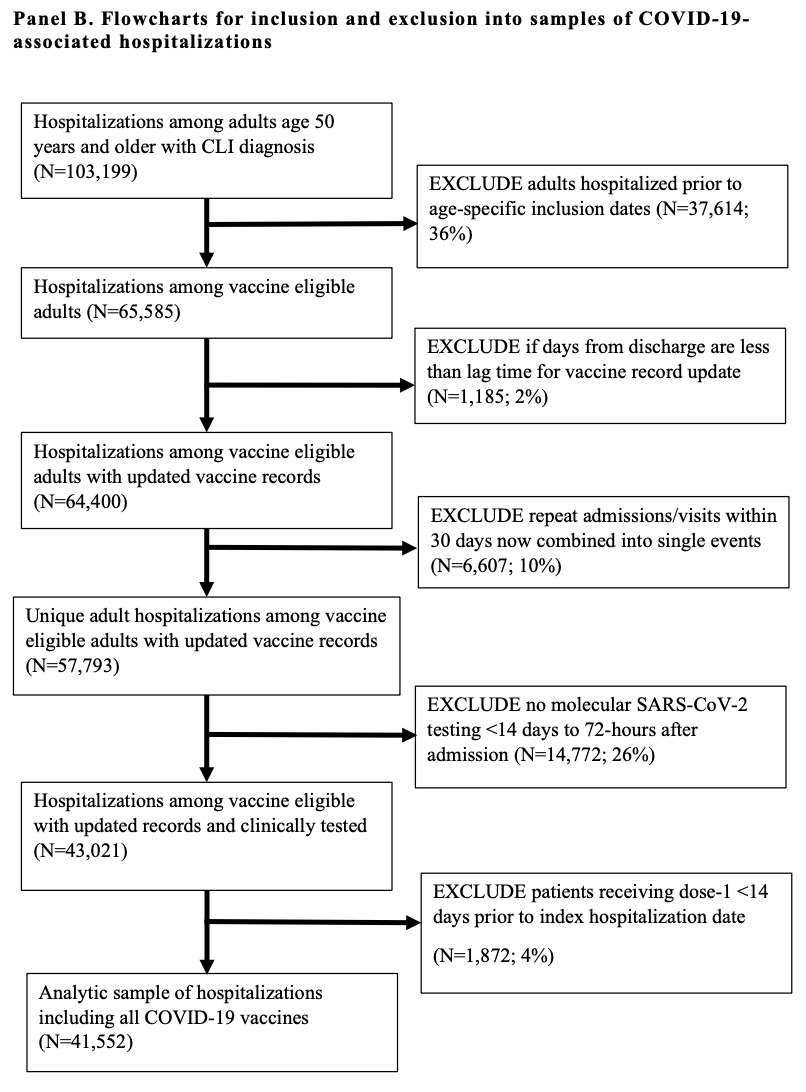
Excluding 1-4 makes sense.
Excluding 5, dose1 vaccinated <14 days, does not make any sense to me! Are these hospitalizations in connection with the vaccine?
Excluding 5, dose1 vaccinated <14 days, does not make any sense to me! Are these hospitalizations in connection with the vaccine?
In the first chart, I have included the fifth category, specifically 1,872 CLI hospitalizations that were excluded by the authors.
Notably here, the authors also made a simple math mistake! Unbelievable!!
Notably here, the authors also made a simple math mistake! Unbelievable!!
So the main result of their study was:
"The effectiveness of full messenger RNA (mRNA) vaccination (≥14 days after the second dose) was 89% [...] against laboratory-confirmed SARS-CoV-2 infection leading to hospitalization [...]"
OK, so 89% effective. Great, right?
"The effectiveness of full messenger RNA (mRNA) vaccination (≥14 days after the second dose) was 89% [...] against laboratory-confirmed SARS-CoV-2 infection leading to hospitalization [...]"
OK, so 89% effective. Great, right?
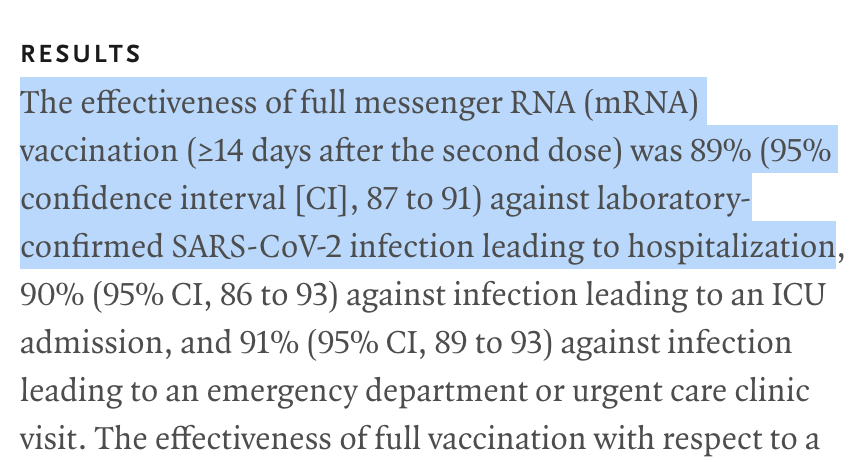
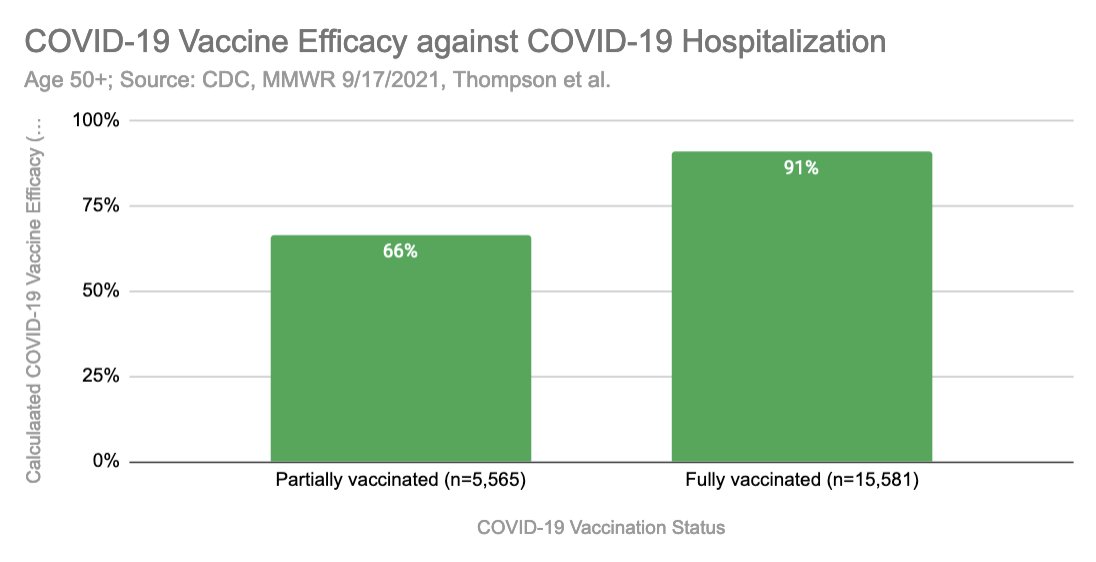
I have calculated Covid19 Hosp. Vaccine Efficacy (VE) based on the raw numbers, and I arrive at 91%. That's close, and the reason why it's off by 2% is the additional statistical corrections the authors did (age, testing bias, etc.).
Ok, so what’s the problem with this?
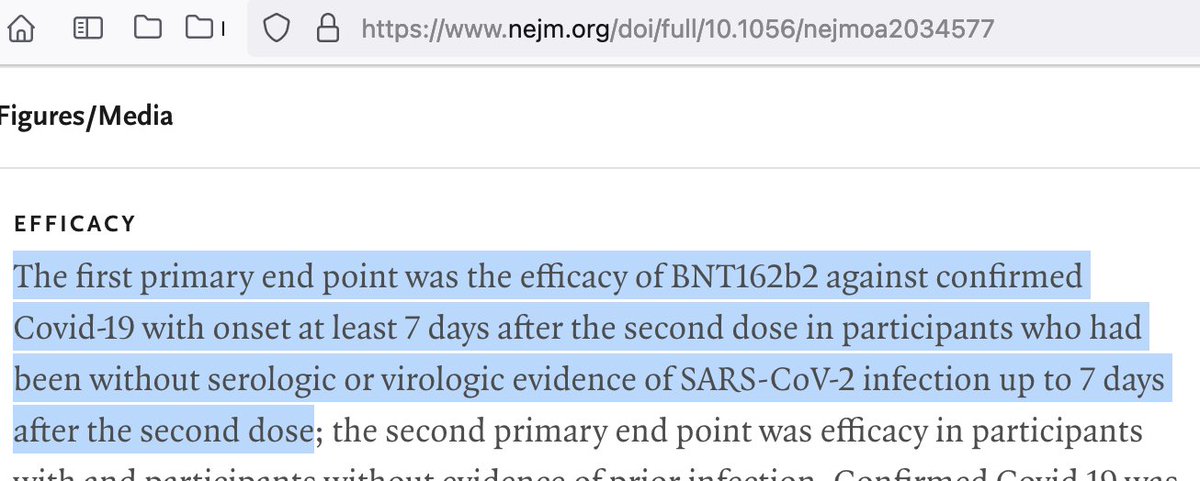
The problem remains to be the highly sensitive PCR test. Confirmed covid in this case is defined as CLI & PCR+. Same as in the vaccine studies, see here Pfizers.
They did not tell us the rate of all-cause sickness or CLI!
The problem remains to be the highly sensitive PCR test. Confirmed covid in this case is defined as CLI & PCR+. Same as in the vaccine studies, see here Pfizers.
They did not tell us the rate of all-cause sickness or CLI!
So if we calculate the vaccine efficacy in the same manner as before, taking into account all the CLI admissions including the excluded 1,872 visits (dose1 <14 day vaxxed), I calculate a VE of -13%!


Important note:
All following charts are excluding the 1,872 “patients receiving dose-1 <14 days prior to index hospitalization date”, since they were excluded in the final study sample, and no detailed information is available!
All following charts are excluding the 1,872 “patients receiving dose-1 <14 days prior to index hospitalization date”, since they were excluded in the final study sample, and no detailed information is available!
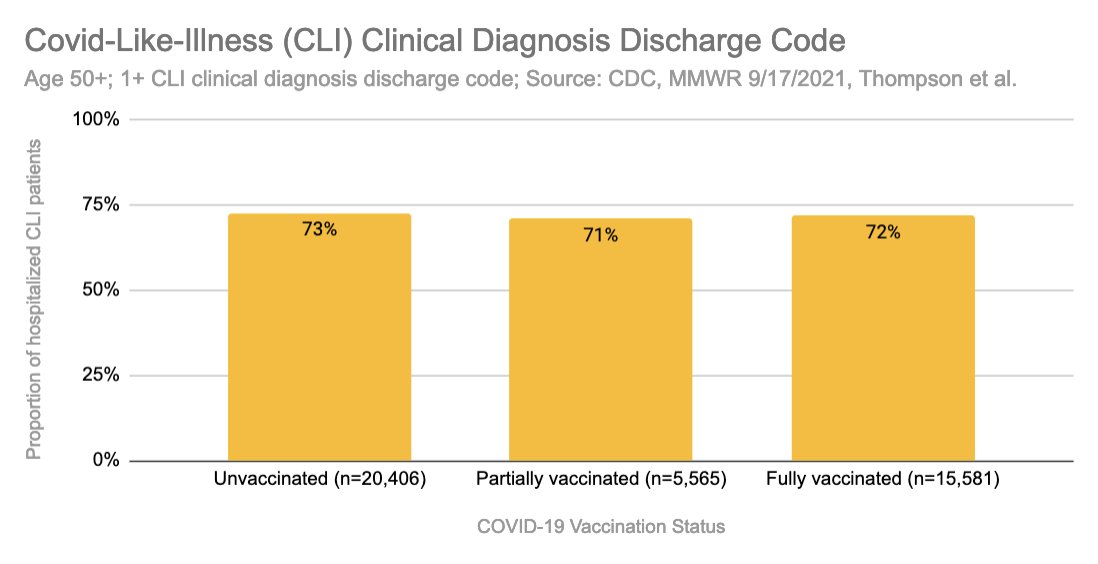
So, based on the study sample of 41,552, what if we only look at how many people actually got sick?
If we actually look at how many people were diagnosed by their physician with CLI, we can see that all three groups were diagnosed with about the same rate... Odd right?
If we actually look at how many people were diagnosed by their physician with CLI, we can see that all three groups were diagnosed with about the same rate... Odd right?
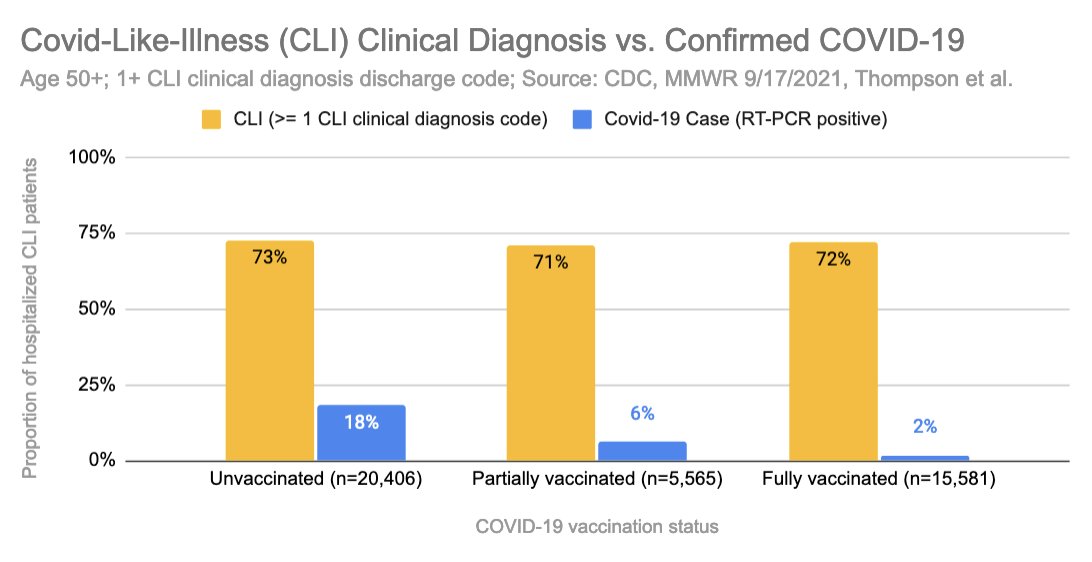
Here's the same chart, CLI clinical diagnosis, with the COVID-19 RT-PCR test positivity (blue).
We can observe that while CLI diagnosis remains steady; Covid cases are significantly lower in vaccinated. Why is that? More on that topic later below…
We can observe that while CLI diagnosis remains steady; Covid cases are significantly lower in vaccinated. Why is that? More on that topic later below…
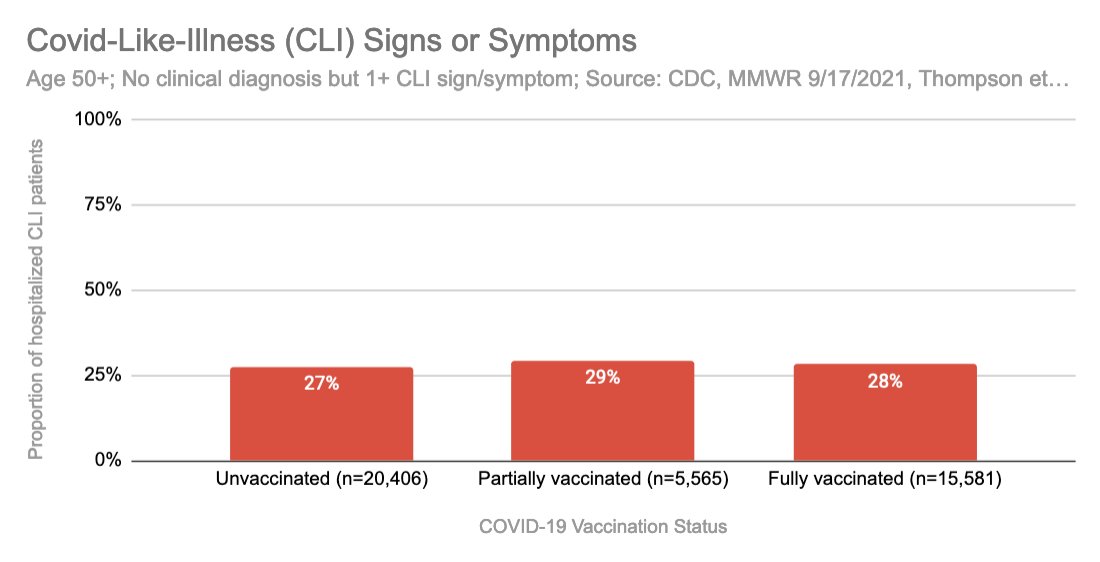
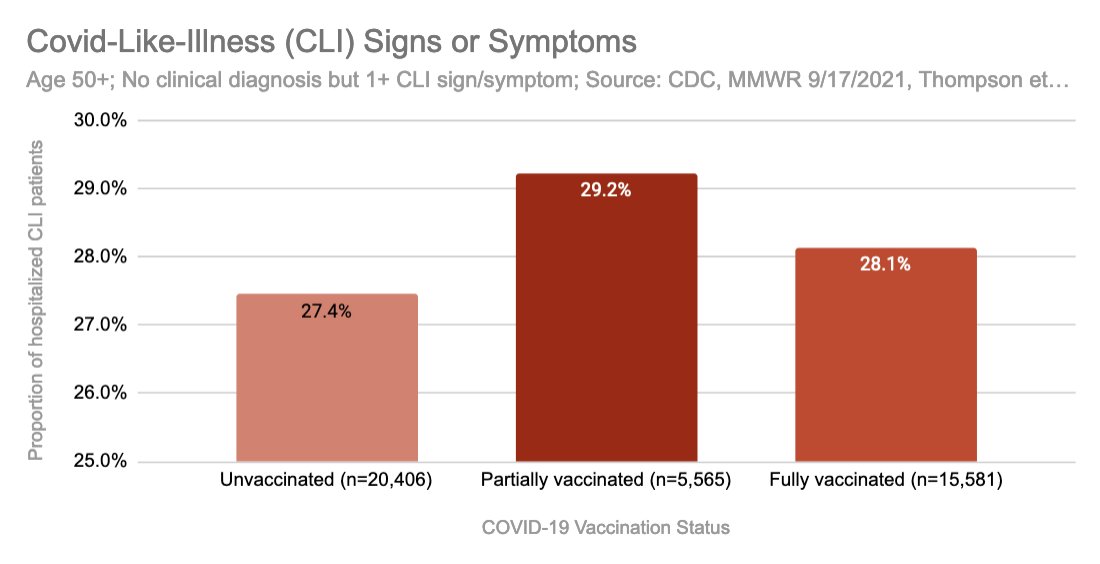
First let's look at actual Covid-Like-Illness (CLI) symptoms! This is what IMO should be the relevant metric, as this is a sign that a human is potentially sick FROM a respiratory virus.
We observe the same effect, the rate of symptomatic CLI is very similar!
We observe the same effect, the rate of symptomatic CLI is very similar!
Let's see how these people tested for Covid-19 with the PCR test?
Similar picture as before, while partially vaccinated, and vaccinated are slightly more symptomatic, they test less positive for the SARS-CoV-2 virus.
Similar picture as before, while partially vaccinated, and vaccinated are slightly more symptomatic, they test less positive for the SARS-CoV-2 virus.
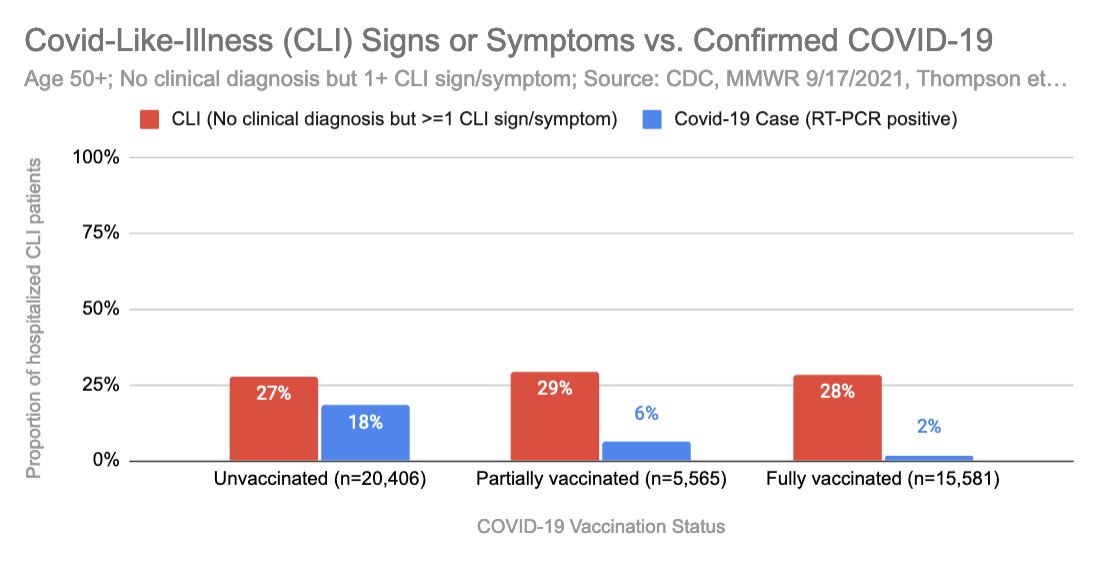
The differences between symptomatic CLI could be by chance, or could it be possible, that they are due to the vaccine itself?
Specifically, partially vaccinated had the most symptoms!
Note, that this does not even include the 1,872 excluded dose1/<14day patients!!!
Specifically, partially vaccinated had the most symptoms!
Note, that this does not even include the 1,872 excluded dose1/<14day patients!!!
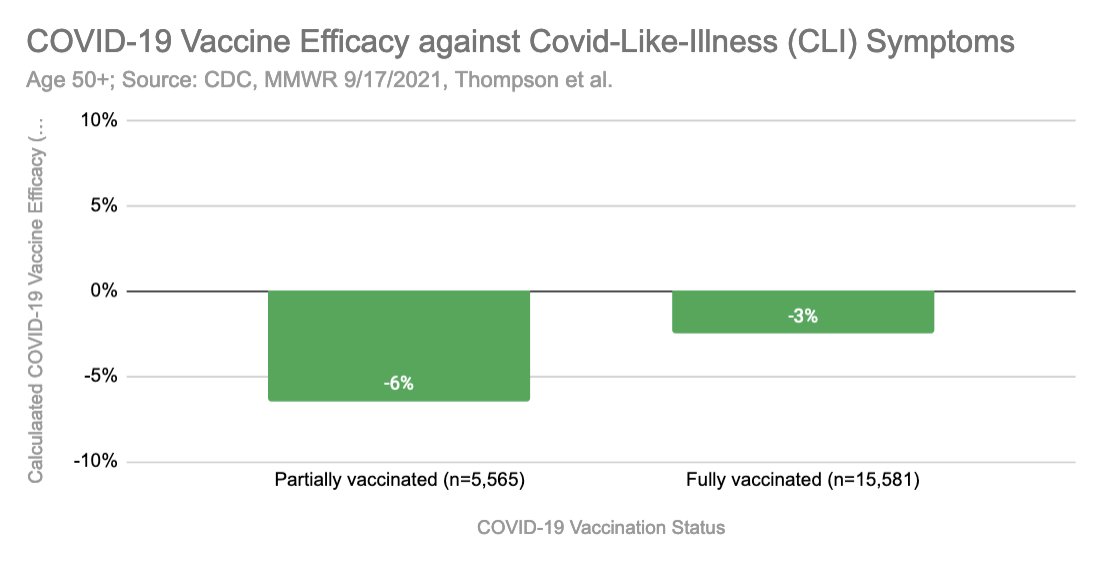
In the same manner as the original authors, we can now calculate the Vaccine Efficacy against symptomatic Covid-Like-Illness (CLI).
Huh?! Negative too. Yep, that's right. Because based on the data, the vaccinated groups actually experience more CLI symptoms.
Huh?! Negative too. Yep, that's right. Because based on the data, the vaccinated groups actually experience more CLI symptoms.
Interesting, right? So this means that despite Covid19 vaccination, people appear to get as sick and hospitalized (if not even more!), as before?!
Here are some other aspects that I looked at:
Here are some other aspects that I looked at:
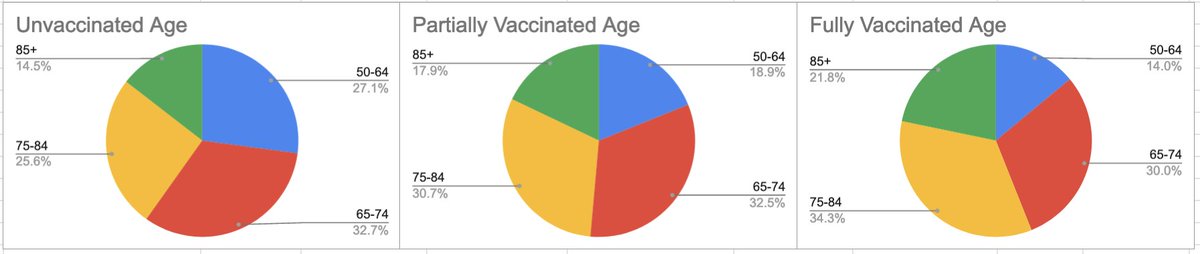
1) Age:
Observation: Older age groups have higher vaxx rate, so these charts are in line with expectations.
Observation: Older age groups have higher vaxx rate, so these charts are in line with expectations.
2) Comorbidities
Did not appear to be a driving factor as the difference was within 2-3 percentage points.
Did not appear to be a driving factor as the difference was within 2-3 percentage points.
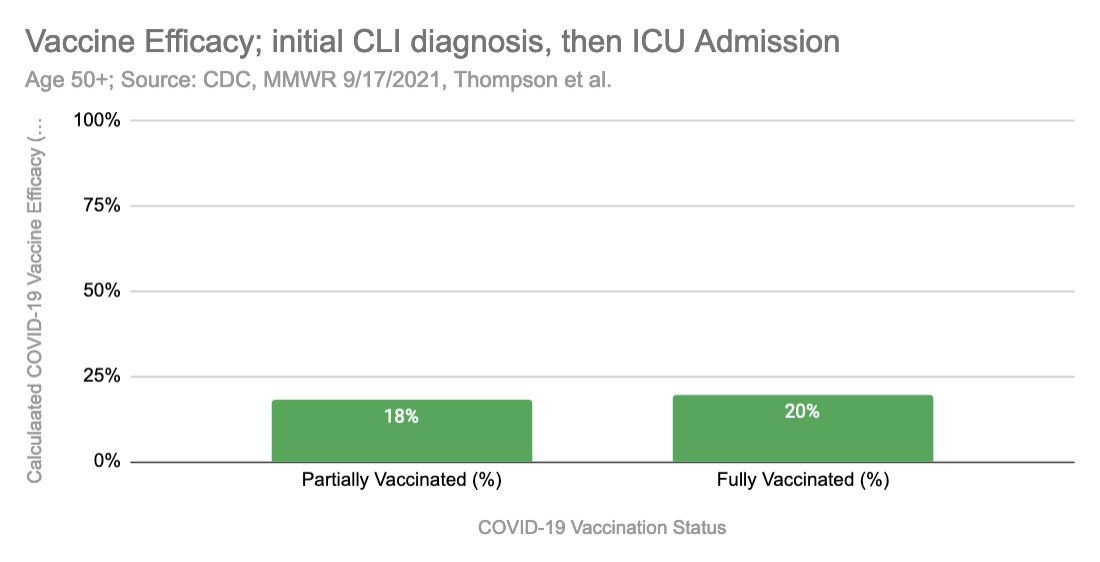
3) Hospitalization, that later lead to ICU admission
Between 16-20% of initially as CLI admitted later went to ICU.
There’s a slight difference in favor of vaxxed. However, this diff is rather small in magnitude. Could be due to confounders/chance, physician bias, exclusion...
Between 16-20% of initially as CLI admitted later went to ICU.
There’s a slight difference in favor of vaxxed. However, this diff is rather small in magnitude. Could be due to confounders/chance, physician bias, exclusion...
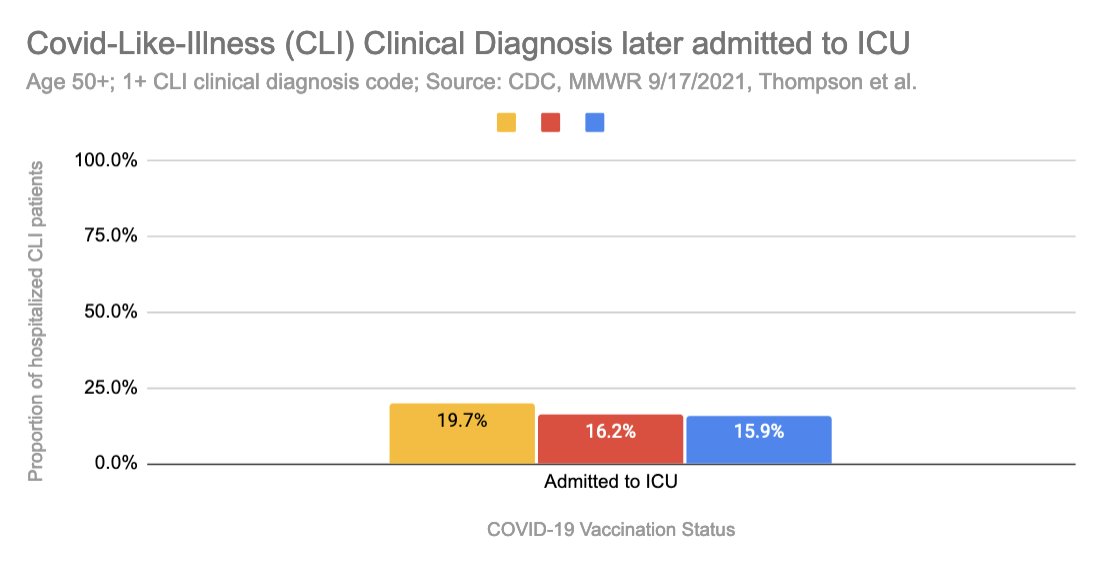
Assuming these were accurate numbers, it would only yield a 20% VE, which would be modest, and way below CDC’s 50% threshold.
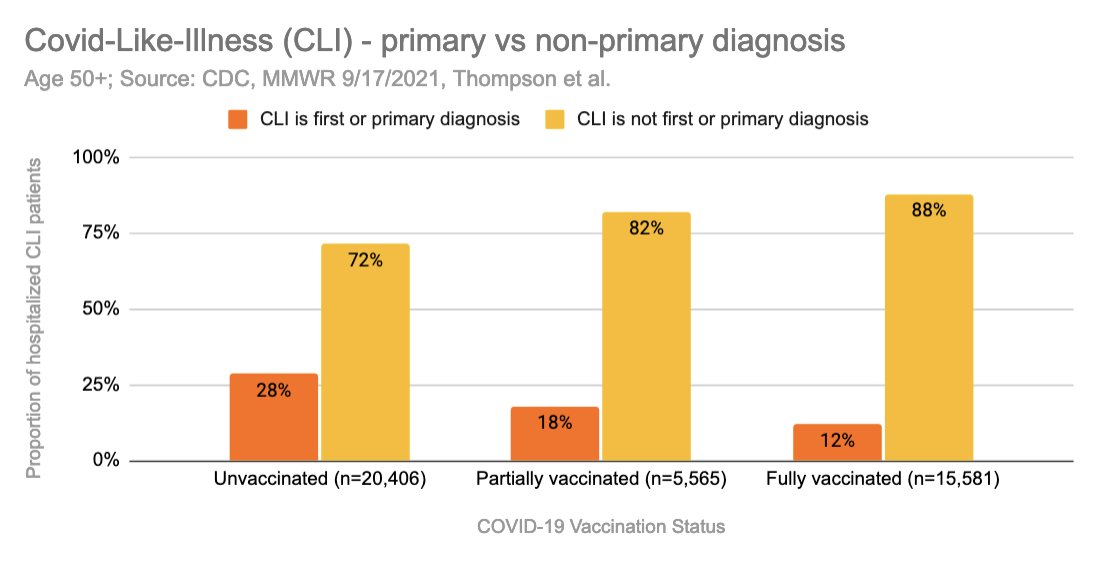
4) Rank of CLI diagnosis
How they coded the CLI diagnosis, primary vs non-primary.
We can see that the primary CLI diagnosis decr. by about half from unvaxxed to fully vaxx. Could this also be due to physician bias?
Since we know that symptoms are equal between groups.
How they coded the CLI diagnosis, primary vs non-primary.
We can see that the primary CLI diagnosis decr. by about half from unvaxxed to fully vaxx. Could this also be due to physician bias?
Since we know that symptoms are equal between groups.
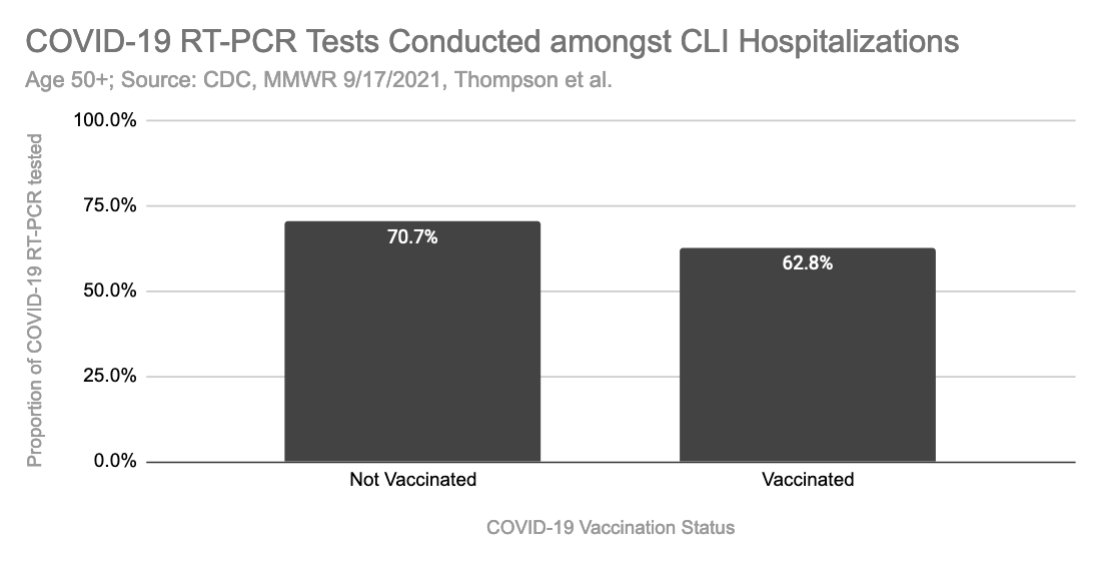
5) Testing Propensity (Bias) between the groups.
Based on the data provided, I find that unvaccinated hospitalized CLI/50+ patients, are 11% more often tested for Covid19, or vaccinated CLI/50+ patients are 12.5% less often tested.
Based on the data provided, I find that unvaccinated hospitalized CLI/50+ patients, are 11% more often tested for Covid19, or vaccinated CLI/50+ patients are 12.5% less often tested.
Summary/Interpretation:
1) Rate of CLI admission, diagnosis, symptoms/signs similar between unvaccinated vs vaccinated (possibly even higher in vaccinated) → No sign. difference in covid like illness between vaxx groups.
1) Rate of CLI admission, diagnosis, symptoms/signs similar between unvaccinated vs vaccinated (possibly even higher in vaccinated) → No sign. difference in covid like illness between vaxx groups.
2) Study sample exclusions lead to distortion of data:
such as 1,872 excluded dose1 <14 day vaxxed.
Such as 1,847 potentially excluded vaccinated CLI’s due to testing bias (-12.5%/11%)
such as 1,872 excluded dose1 <14 day vaxxed.
Such as 1,847 potentially excluded vaccinated CLI’s due to testing bias (-12.5%/11%)
3) Rate of Covid19 test positives are significantly lower, but why? See some explanations below:
Possible Explanations/Open Questions:
So now that we have proven, that vaccinated people do not get significantly less sick with CLI and therefore in general, what might actually be happening?
So now that we have proven, that vaccinated people do not get significantly less sick with CLI and therefore in general, what might actually be happening?
We do not know for certain, as this would require all-cause hospitalization/death data by vaxx status. No country (afaik) publishes this, specifically including # of performed tests by vaxx status.
CDC has acknowledged to me that they have this data, but they do not publish it and have denied my FOIA request (for now)... Why?
docs.google.com/document/d/1EG…
docs.google.com/document/d/1EG…
We can only list out some hypothesis:
A) The vaccines are effective in eradicating the virus, at given VE (90%), BUT this does not lead to less sickness (CLI).
(i) Is similar sickness, then caused by other pathogens?
A) The vaccines are effective in eradicating the virus, at given VE (90%), BUT this does not lead to less sickness (CLI).
(i) Is similar sickness, then caused by other pathogens?
(ii) If the vaccine is eradicating a virus, but people still get sick at the same rate, what's the purpose of mass vaccinations?
B) Is there a difference in testing? We know everyone in the study sample is tested, but are they using the exact same tests (protocols, CT, # of genes, etc.)?
C) Is illness severity decreasing due to the vaccine?
In the data, we can see a little less ICU admissions in the vaccinated groups. However the decrease is only one fifth of the claimed VE.
In the data, we can see a little less ICU admissions in the vaccinated groups. However the decrease is only one fifth of the claimed VE.
..C) Hence other factors, such as chance, physician bias, etc. could be at play here. Also we could see that exclusions and testing propensity distort the data towards unvaccinated.
Additional thoughts:
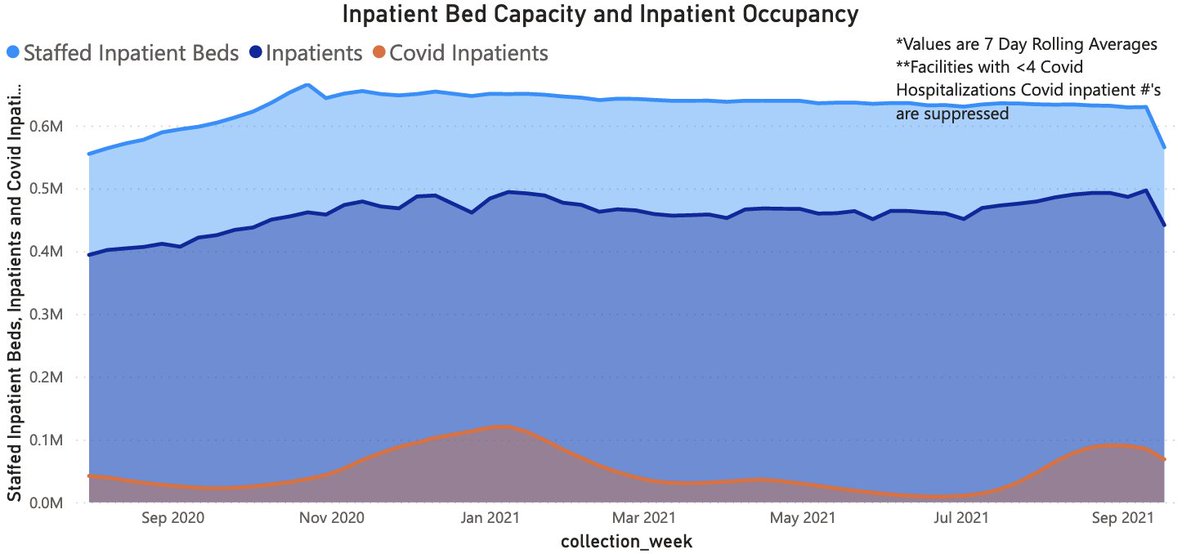
In my opinion this proves that the roughly same amount of people in each group are hospitalized, regardless of the Covid19 vaccination status, and that PCR+ does not seem to lead to less CLI.
In my opinion this proves that the roughly same amount of people in each group are hospitalized, regardless of the Covid19 vaccination status, and that PCR+ does not seem to lead to less CLI.
We can observe this in the real world. See here for examples for Germany and the US.
Note, that the CLI diagnosis (orange) is not very much correlated to the total hospitalizations. This is likely due to the same effect as described above.
Note, that the CLI diagnosis (orange) is not very much correlated to the total hospitalizations. This is likely due to the same effect as described above.

Methodology/Sources:
CDC MMWR: cdc.gov/mmwr/volumes/7…
Study: nejm.org/doi/10.1056/NE…
Calculations: docs.google.com/spreadsheets/d…
CDC MMWR: cdc.gov/mmwr/volumes/7…
Study: nejm.org/doi/10.1056/NE…
Calculations: docs.google.com/spreadsheets/d…
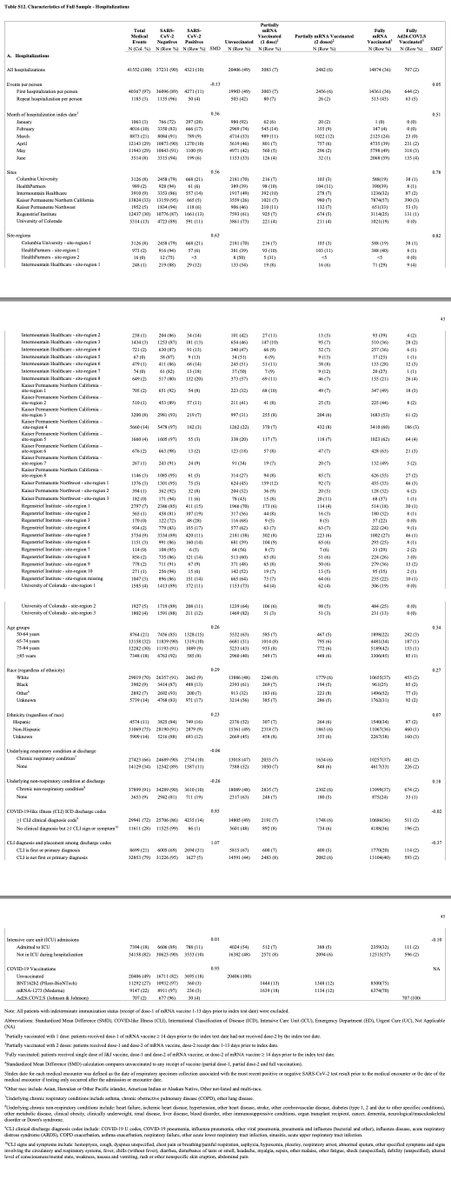
Most of the data, used for calculations was extracted from this table, of the study appendix.
nejm.org/doi/suppl/10.1…
nejm.org/doi/suppl/10.1…

Thanks to:
@shasafaya for pointing me to this study & working with me on this!
@prof_shahar for comment, feedback and advice!
@tlowdon for pointing me to the US hospitalization dashboard.
Everyone for following, liking, sharing and commenting!
Please let me know what you think!
@shasafaya for pointing me to this study & working with me on this!
@prof_shahar for comment, feedback and advice!
@tlowdon for pointing me to the US hospitalization dashboard.
Everyone for following, liking, sharing and commenting!
Please let me know what you think!
Please let me know if there are any errors/mistakes in this analysis.
@threadreaderapp unroll please
@threadreaderapp unroll please
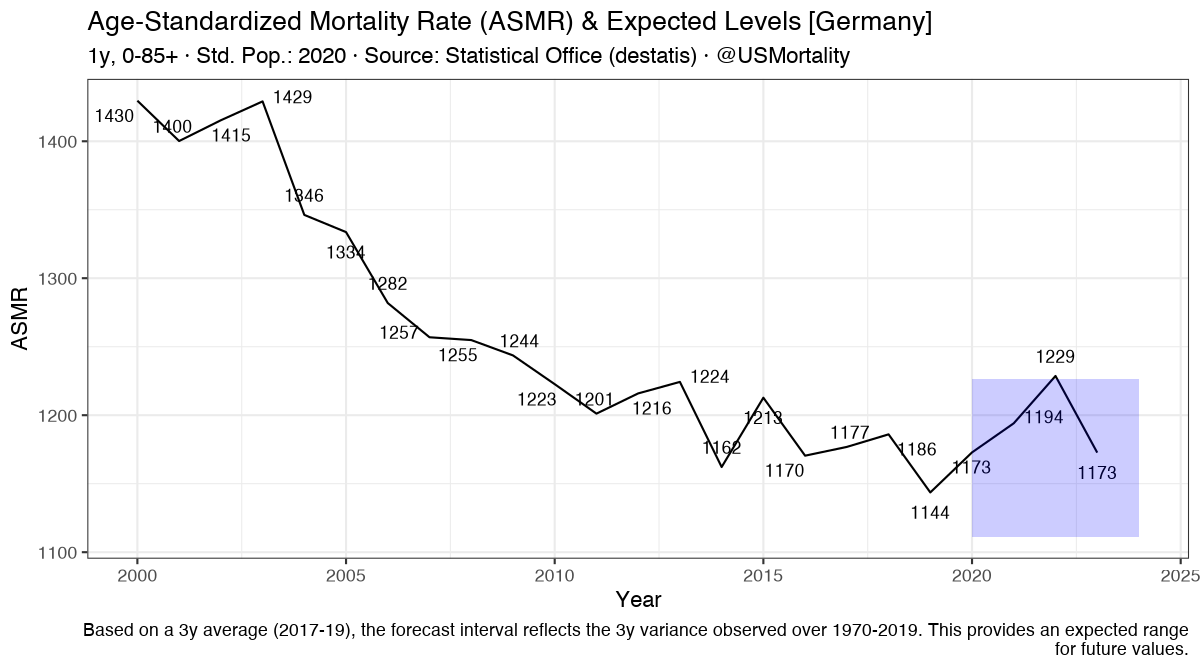
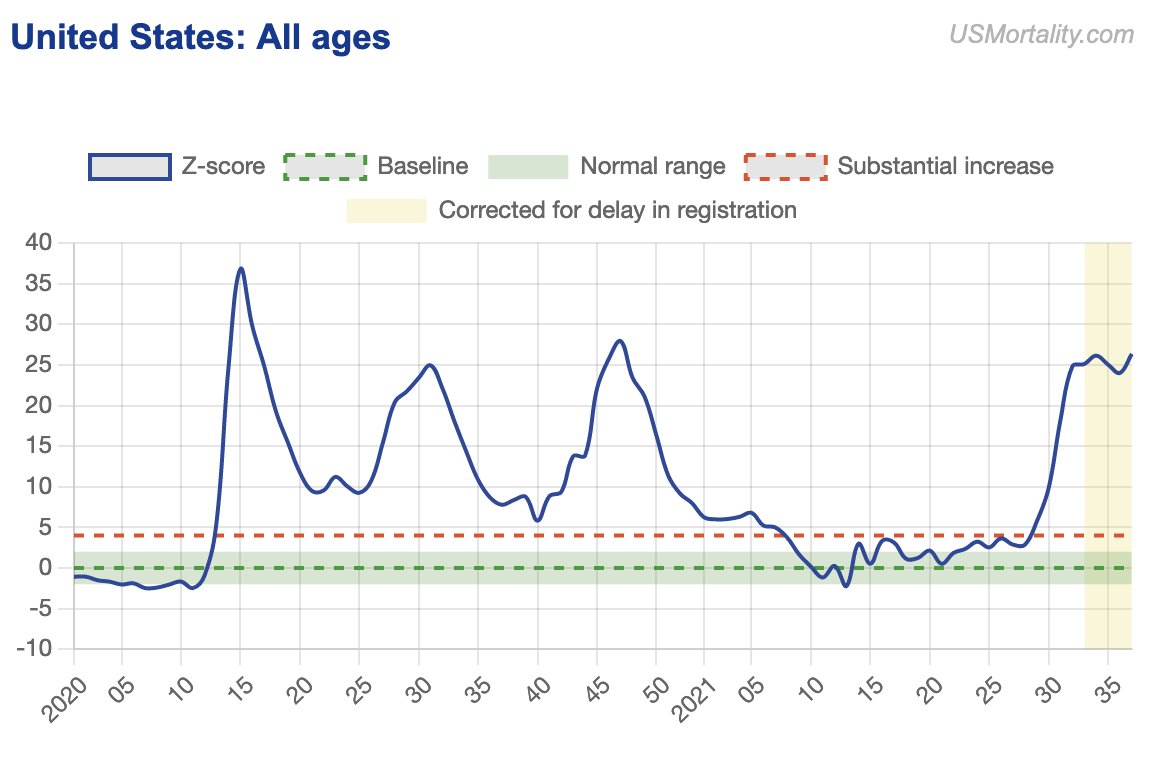
And if you haven't seen my website yet, check out USMortality.com for latest US all-cause (pop/age corrected) mortality data.
Maybe @CDCgov can let us know why we're seeing huge excess deaths again in the US... Is it really all the unvaxxed?
Please just publish the data!
Maybe @CDCgov can let us know why we're seeing huge excess deaths again in the US... Is it really all the unvaxxed?
Please just publish the data!
• • •
Missing some Tweet in this thread? You can try to
force a refresh