For the last 2.5 years, my daughters and I have been rating breakfast places in #charlottesville #cville area. We rated 51 restaurants from 1 (worst) to 10 (best) on taste, presentation, menu, ambiance, & service. We also recorded cost-per-person.
Here's what we learned. 1/
Here's what we learned. 1/
Across 51 restaurants we spent $1,625.36 pre-tip, average cost of $9.91/person (sometimes other family members joined).
Cheapest per person: Duck Donuts $3.10, Sugar Shack $3.41, Bojangles $4.30.
Most expensive per person: The Ridley $27.08, Farm Bell Kitchen $17.81, Fig $17.44
Cheapest per person: Duck Donuts $3.10, Sugar Shack $3.41, Bojangles $4.30.
Most expensive per person: The Ridley $27.08, Farm Bell Kitchen $17.81, Fig $17.44
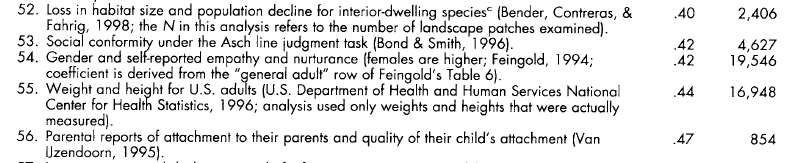
Averaging all 5 ratings across all raters is one way to determine an overall rating. The grand average is 7.1 out of 10 w/ a range of 4.8 to 9.1. How strongly related are cost per person and overall rating?
r=0.36
Just 13% of the variation in quality is associated with cost.
r=0.36
Just 13% of the variation in quality is associated with cost.

Assuming a linear relationship, this modest relationship between cost and quality means that a one point higher quality rating is associated with $12.47 greater cost per person.

But, this modest relationship between cost & quality also means that there are restaurants that exceed the expected quality given their cost (good values) or fall short of expected quality given their cost (bad values). The best & worst values (quality vs cost) are pictured.

Regardless of cost, the top rated breakfast places were Thunderbird Cafe, Quirk Cafe, & Croby's Urban Vittles (now closed). And, the bottom rated were Dunkin', Bojangles, and Cavalier Diner.

When considering taste, presentation, menu, ambiance, & service separately, we get some additional insights.
The top row box shows correlation of each dimension with cost per person. Cost is most strongly associated with presentation & ambiance, & weakly w/taste, menu, & service
The top row box shows correlation of each dimension with cost per person. Cost is most strongly associated with presentation & ambiance, & weakly w/taste, menu, & service

And, among the five ratings, taste & presentation are strongly related as are ambiance with service and presentation. Other factors are only modestly related.
This suggests that personal priorities about dining experience will lead to a different set of top breakfast places.
This suggests that personal priorities about dining experience will lead to a different set of top breakfast places.

The Taste Top 10 features Bluegrass (now closed), Charlie and Litza's, Quality Pie and Oakhurts; and bottom 10 anchored by Cav Diner, Taco Bell, Bojangles, and Tip Top.

The Menu Top 10 features Bluegrass, IHOP, Fig, and Thunderbird; and Bottom 10 anchored by Starbucks, Quality Pie, Bowerbird, and Juice Laundry.
[Our idiosyncratic interests in types of breakfast is most apparent in menu ratings.]
[Our idiosyncratic interests in types of breakfast is most apparent in menu ratings.]

And, the Presentation, Ambiance, and Service Top and Bottom 10 are pictured. Few places received top or bottom marks on all dimensions.


The observed variance across dimensions is interesting. Quality Pie had the most extreme variance (stdev=3.0) with among the highest ratings for taste and presentation and lowest for ambiance and menu. So good, but a disaster inside and right on a busy road outside.
Others with high variation across dimensions were
Taco Bell (2.4): surprisingly good service/ambiance, terrible presentation
Dunkin' (1.9): Good taste, disaster presentation/ambiance
Starbucks (1.9): Good taste, terrible presentation/menu
Taco Bell (2.4): surprisingly good service/ambiance, terrible presentation
Dunkin' (1.9): Good taste, disaster presentation/ambiance
Starbucks (1.9): Good taste, terrible presentation/menu
Finally, there was variation across raters. In blue, all three raters were positively correlated with 36% to 65% shared variance -- lots of idiosyncrasy in our assessments. In red, Joni's quality ratings were least correlated with cost.

Our individual Top and Bottom 10's are pictured. There was consensus on Thunderbird Cafe being the best breakfast place in the Charlottesville area. And, despite being a donut loving family, we had a terrible (dirty restaurant) breakfast at Dunkin'.


Individual interests also played out in unique ways. If Joni woke up in a bad mood, ratings for that restaurant suffered (sorry Farm Bell Kitchen, Michaels' Diner, and Oakhurst).
Finally, all data are publicly accessible for reanalysis and for creating better visualizations. docs.google.com/spreadsheets/d…
This concludes the first ever breakfast rating open science twitter thread.
This concludes the first ever breakfast rating open science twitter thread.
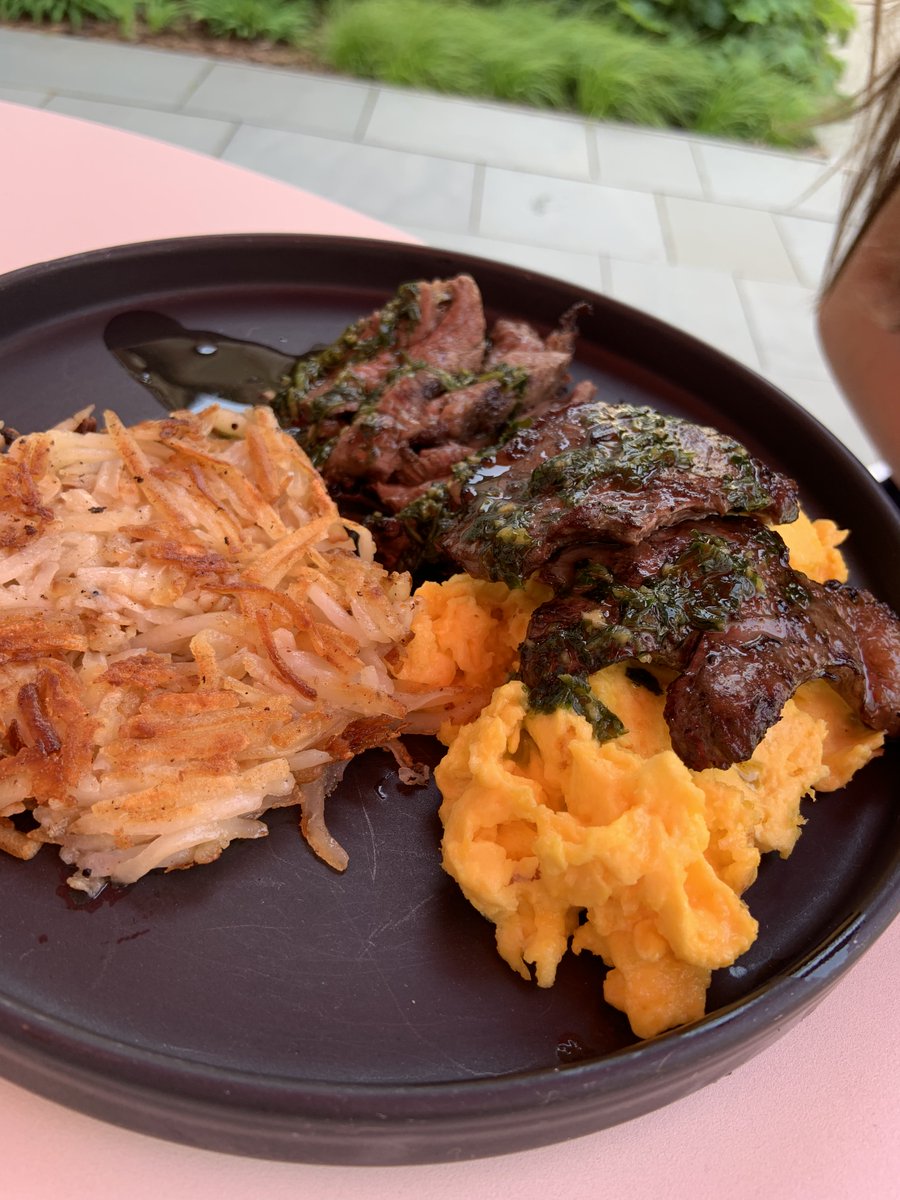
A few visual highlights from Haven...


• • •
Missing some Tweet in this thread? You can try to
force a refresh