Weekends are dedicated for the review of weekly scale price charts.
After the close of each trading day, review the end of day charts.

After the close of each trading week, review the end of week charts.

Repeat this for a month and you will develop a routine to review markets/patterns.
Since 2007, I've been doing this every single day/week/month.

Finding opportunities has become one of the best part of trading business.
I don't know which came first but probably I've developed some good visual skills where I can spot things I have seen before.

I travel, see a street, a coffee shop. Years later I see the place for a second on TV, I can tell where it was. Strange.

• • •

Missing some Tweet in this thread? You can try to force a refresh
 

Keep Current with Aksel Kibar, CMT

Aksel Kibar, CMT Profile picture

Stay in touch and get notified when new unrolls are available from this author!

Read all threads

This Thread may be Removed Anytime!

PDF

Twitter may remove this content at anytime! Save it as PDF for later use!

Try unrolling a thread yourself!

how to unroll video
  1. Follow @ThreadReaderApp to mention us!

  2. From a Twitter thread mention us with a keyword "unroll"
@threadreaderapp unroll

Practice here first or read more on our help page!

More from @TechCharts

3 Oct
Are you ready for a visual exercise?
Qualities we will be looking for:

1) A clean horizontal boundary

2) Min 3 tests of the pattern boundary

3) If a short trade = needs to be below 200-day
If a long trade = needs to be above 200-day
Find 3 text-book trades / chart pattern setups

This is a weekly scale price chart and the moving average is 40 week period (200-day)

Answers format:
Pattern name/completed year
Read 6 tweets
3 Oct
Define a research universe 500, 1000 names... depends on your time dedicated for market research each day & weekend.

Make sure you go through the same list every single day.

What you miss earlier you might capture later.

You see the development of price charts better
Open each chart with the same template. Don't go into style drift by saying: Hmm.. let me see what X indicator is doing or let me go into hourly chart etc.

You have 1hr (or how much it takes to finish the list you have built) to finish the work and move off the screen.
Before you finalize, see if any pattern fit your criteria. Save those to a separate folder and review them the next day first thing after the market close. That's your watchlist.
Read 5 tweets
23 Sep
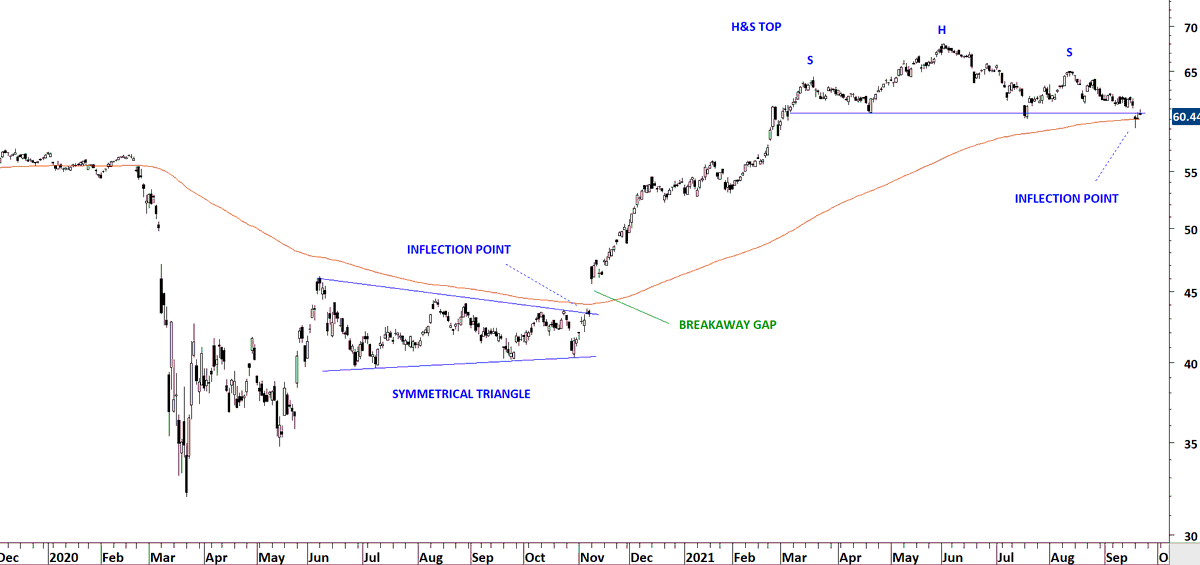
(1) Let's study this chart and discuss some of the concepts in classical charting & technical analysis. It is a great chart. Image
(2) Symmetrical triangle formed right below the 200-day average. Breakout took place at the same price level which I call inflection point. When such condition is met, it is a high conviction setup for me.
(3) Breakout took place with a gap opening. This was a clear breakaway gap as explained by Schabacker.

Breakout took place above the 200-day average and it was a change in trend as well. A significant technical development.
Read 4 tweets
23 Sep
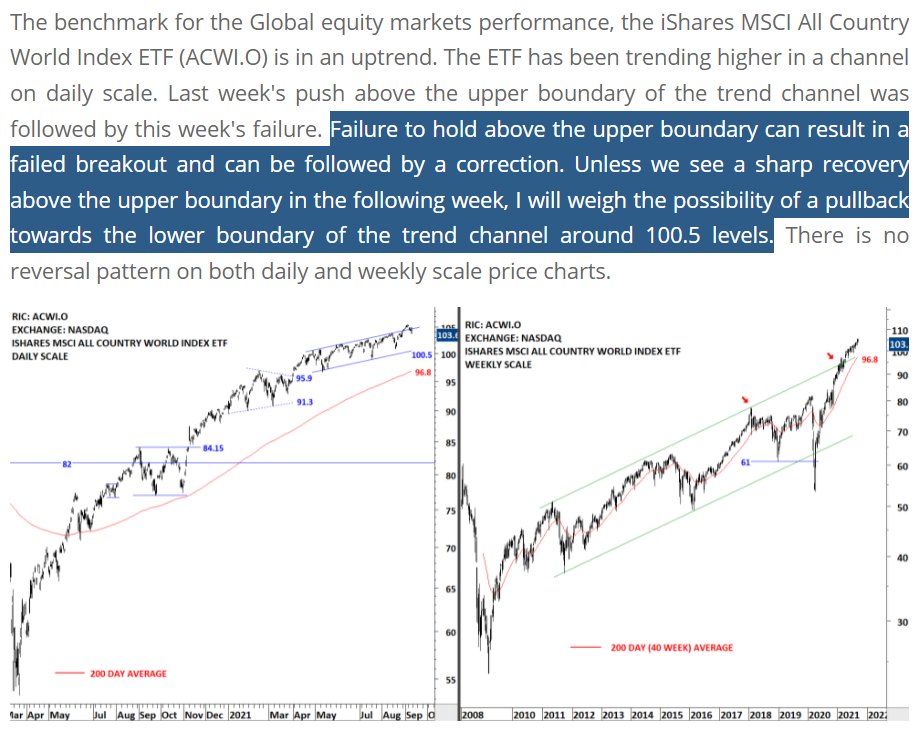
Step by step analysis of price action around rising trend channels.

A breach above the upper boundary, if not followed by an acceleration on the upside, can result in a failed breakout.

Sept 4 Global Equity Markets report >> blog.techcharts.net/index.php/prem… Image
Sept 11 >> Price fails to hold above the upper boundary.

blog.techcharts.net/index.php/2021… Image
Sept 18 >> Targeting the lower boundary of the rising trend channel.

blog.techcharts.net/index.php/2021… Image
Read 4 tweets
22 Sep
Richard Schabacker - Technical Analysis and Stock Market Profits on Gaps... ImageImage
I incorporate breakaway gaps into my analysis as I mainly trade breakouts. Breakaway gaps will appear at the time of breakout through the pattern boundary. Image
An example of a breakaway gap. Image
Read 4 tweets
24 Aug
If after a breakout your position is holding its gains and not turning negative (no challenge of pattern boundary), chances are high the move will extend way beyond the price objective.

In such cases employ a trend following tool to capture more of the uptrend. Image
Few examples below: Image
Image
Read 4 tweets

Did Thread Reader help you today?

Support us! We are indie developers!


This site is made by just two indie developers on a laptop doing marketing, support and development! Read more about the story.

Become a Premium Member ($3/month or $30/year) and get exclusive features!

Become Premium

Too expensive? Make a small donation by buying us coffee ($5) or help with server cost ($10)

Donate via Paypal Become our Patreon

Thank you for your support!

Follow Us on Twitter!

:(