(1) Let's study this chart and discuss some of the concepts in classical charting & technical analysis. It is a great chart. Image
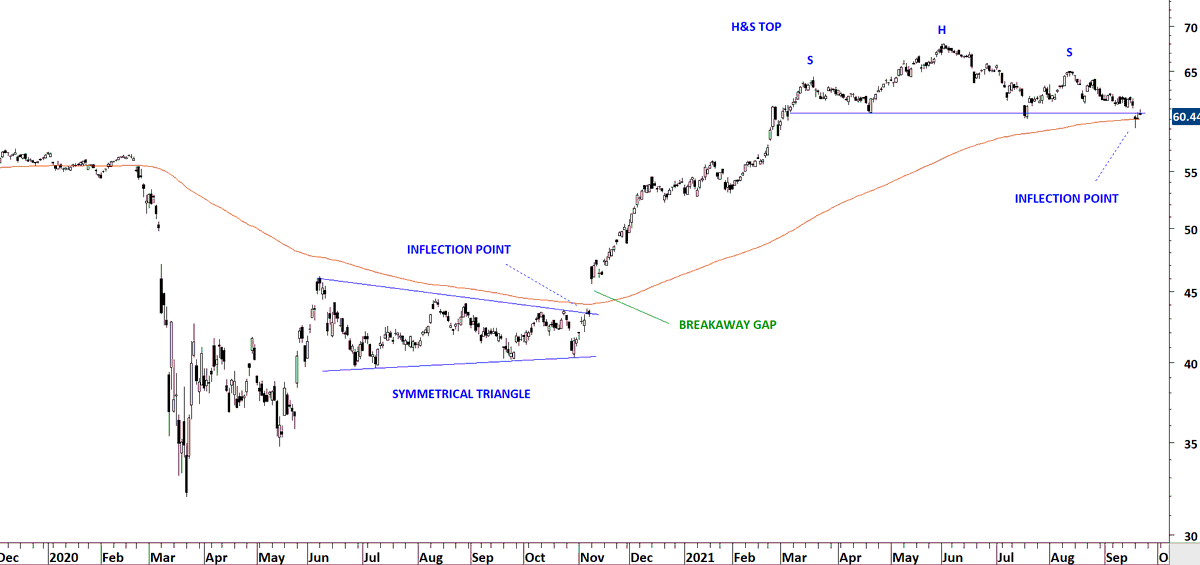
(2) Symmetrical triangle formed right below the 200-day average. Breakout took place at the same price level which I call inflection point. When such condition is met, it is a high conviction setup for me.
(3) Breakout took place with a gap opening. This was a clear breakaway gap as explained by Schabacker.

Breakout took place above the 200-day average and it was a change in trend as well. A significant technical development.
(4) Now, a clean H&S top has formed with price testing the 200-day average forming what I call an inflection point. Means: if a breakdown takes place it will be a high conviction signal. A possible change in trend.

• • •

Missing some Tweet in this thread? You can try to force a refresh
 

Keep Current with Aksel Kibar, CMT

Aksel Kibar, CMT Profile picture

Stay in touch and get notified when new unrolls are available from this author!

Read all threads

This Thread may be Removed Anytime!

PDF

Twitter may remove this content at anytime! Save it as PDF for later use!

Try unrolling a thread yourself!

how to unroll video
  1. Follow @ThreadReaderApp to mention us!

  2. From a Twitter thread mention us with a keyword "unroll"
@threadreaderapp unroll

Practice here first or read more on our help page!

More from @TechCharts

23 Sep
Step by step analysis of price action around rising trend channels.

A breach above the upper boundary, if not followed by an acceleration on the upside, can result in a failed breakout.

Sept 4 Global Equity Markets report >> blog.techcharts.net/index.php/prem… Image
Sept 11 >> Price fails to hold above the upper boundary.

blog.techcharts.net/index.php/2021… Image
Sept 18 >> Targeting the lower boundary of the rising trend channel.

blog.techcharts.net/index.php/2021… Image
Read 4 tweets
22 Sep
Richard Schabacker - Technical Analysis and Stock Market Profits on Gaps... ImageImage
I incorporate breakaway gaps into my analysis as I mainly trade breakouts. Breakaway gaps will appear at the time of breakout through the pattern boundary. Image
An example of a breakaway gap. Image
Read 4 tweets
24 Aug
If after a breakout your position is holding its gains and not turning negative (no challenge of pattern boundary), chances are high the move will extend way beyond the price objective.

In such cases employ a trend following tool to capture more of the uptrend. Image
Few examples below: Image
Image
Read 4 tweets
11 Aug
Waiting for a daily close above the resistance by 3% margin is a trading tactic Edwards & Magee discussed in their book Technical Analysis of Stock Trends.

For some of you this might be a too late entry. Remember that trading tactics can be different for each trader/investor.
As there is no perfect stop-loss placement, there is also no perfect entry condition. Sometimes you can miss the breakouts due to gap openings. I'm sure many of you managed to position well into this H&S continuation breakout. Image
There are several ways to trade a chart pattern. From anticipatory positions before the breakout to buying during re-test after a breakout...

However, there is only one way to identify a text-book classical chart pattern. This one was a H&S continuation.
Read 6 tweets
11 Jul
I will write a couple of points on #VOLUME. It's a #THREAD. I get a lot of questions regarding volume confirmation on chart patterns. Here is my story with volume as a supporting indicator.
I learned #technicalanalysis and charting with the default chart setup of volume at the bottom of each chart. I know how to read volume with price charts.
Around the subprime mortgage crisis and the financial meltdown, I was managing the largest fund in AUM in the UAE and a sizable one in the MENA.
Read 12 tweets
9 Jul
Trying to pick tops and bottoms in a trend is a low probability event.
Identifying an existing trend and trying to capture the trend periods is a high probability event.

First you are going in the direction of the existing trend. There is momentum in your favor.

Second, you have "better" levels of stop placement incase you are wrong.
Better meaning, levels that are actually recognized by market participants as they are formed by the battle (supply & demand) during their transactions.
Read 4 tweets

Did Thread Reader help you today?

Support us! We are indie developers!


This site is made by just two indie developers on a laptop doing marketing, support and development! Read more about the story.

Become a Premium Member ($3/month or $30/year) and get exclusive features!

Become Premium

Too expensive? Make a small donation by buying us coffee ($5) or help with server cost ($10)

Donate via Paypal Become our Patreon

Thank you for your support!

Follow Us on Twitter!

:(