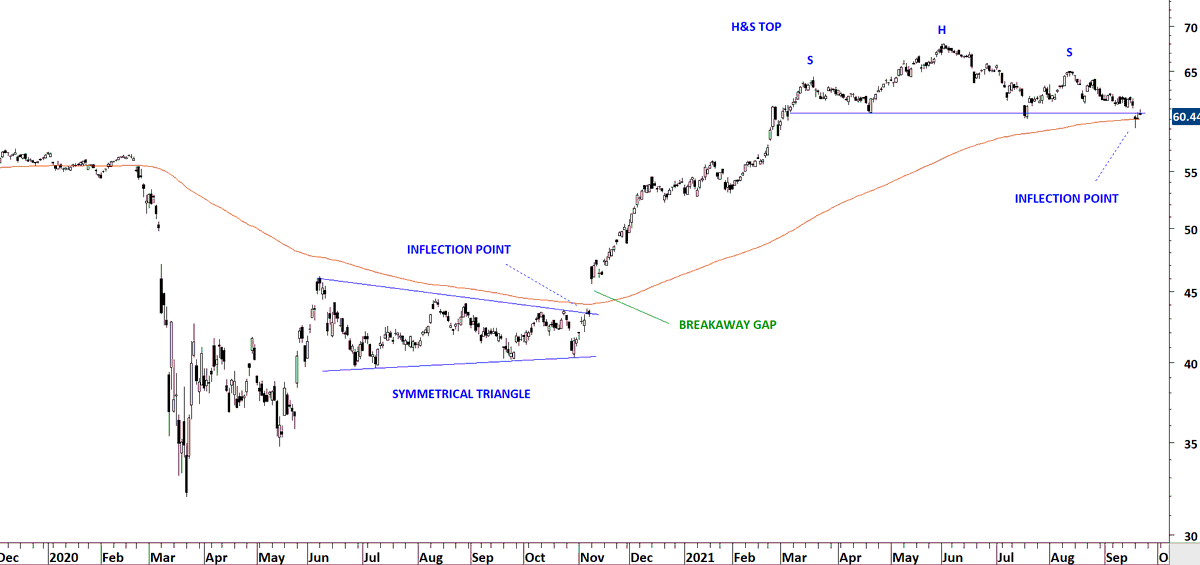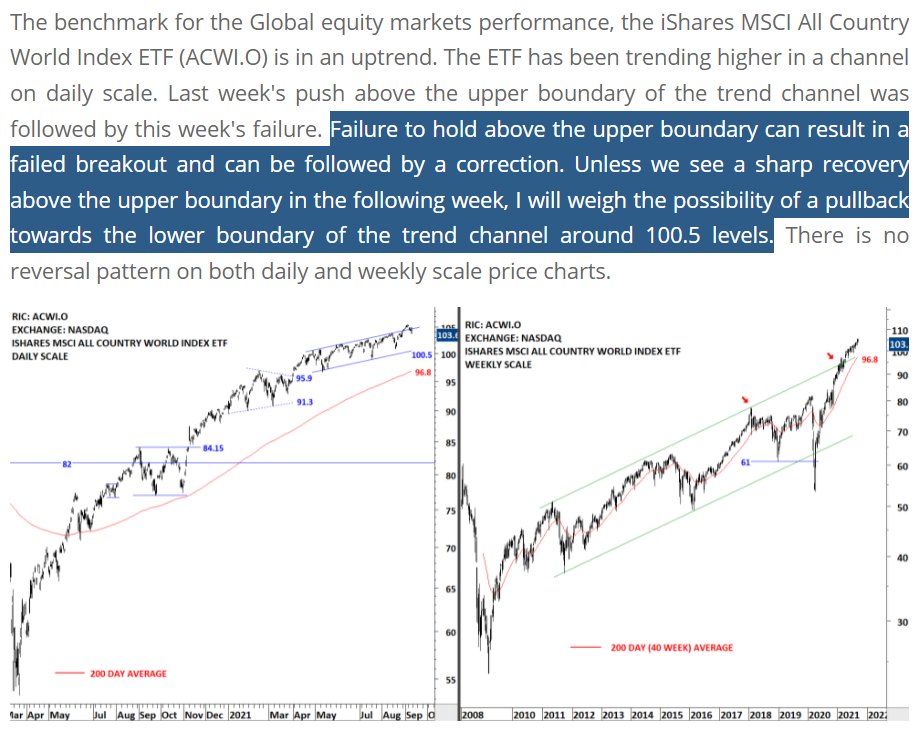
Are you ready for a visual exercise?
Qualities we will be looking for:
1) A clean horizontal boundary
2) Min 3 tests of the pattern boundary
3) If a short trade = needs to be below 200-day
If a long trade = needs to be above 200-day
1) A clean horizontal boundary
2) Min 3 tests of the pattern boundary
3) If a short trade = needs to be below 200-day
If a long trade = needs to be above 200-day
Find 3 text-book trades / chart pattern setups
This is a weekly scale price chart and the moving average is 40 week period (200-day)
Answers format:
Pattern name/completed year
This is a weekly scale price chart and the moving average is 40 week period (200-day)
Answers format:
Pattern name/completed year

Great stuff. The third pattern is open for discussion but as you can see from the possibilities of ascending triangle, cup & handle or H&S continuation, all of them has similar price projections and bullish implications.
Here is my labelling.
Here is my labelling.

The criticism you will hear: well its always easier to tell things in hindsight.
You will never know if a trade will be successful even if you identify the pattern in a correct way.
We are trying to increase the probability of success slightly by picking right setups
You will never know if a trade will be successful even if you identify the pattern in a correct way.
We are trying to increase the probability of success slightly by picking right setups
So let's look at one recent setup.
Weekly scale price charts I review them with 5 years of data.
The minute I open the chart my eye is fixated to the area right of the dashed line.
What pattern do you see?
Weekly scale price charts I review them with 5 years of data.
The minute I open the chart my eye is fixated to the area right of the dashed line.
What pattern do you see?

• • •
Missing some Tweet in this thread? You can try to
force a refresh


