Just in the last 12 weeks, all-cause excess deaths have been up by 38% compared to the same time frame in 2020. Whatever we are doing, it's not working!
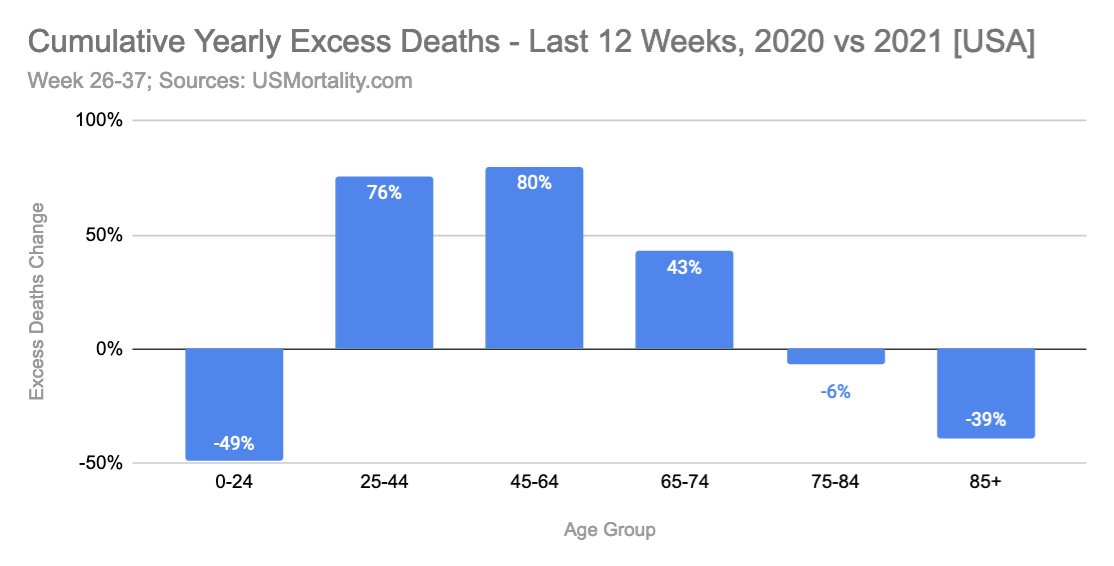
Just to explain, both 2020 & 2021 are measured against the same baseline, the 5y average of '15-'19.
(Of course 2021 baseline is slighly higher, to account for population growth and change in age)
Methodology describe here: usmortality.com/about
Re-posting the 0-24 chart, as there was a copy error in the above posting!
Calculations remain the same.
Note: The above chart can be easily misread; it's relative change to previous year... There's still massive excess mortality!
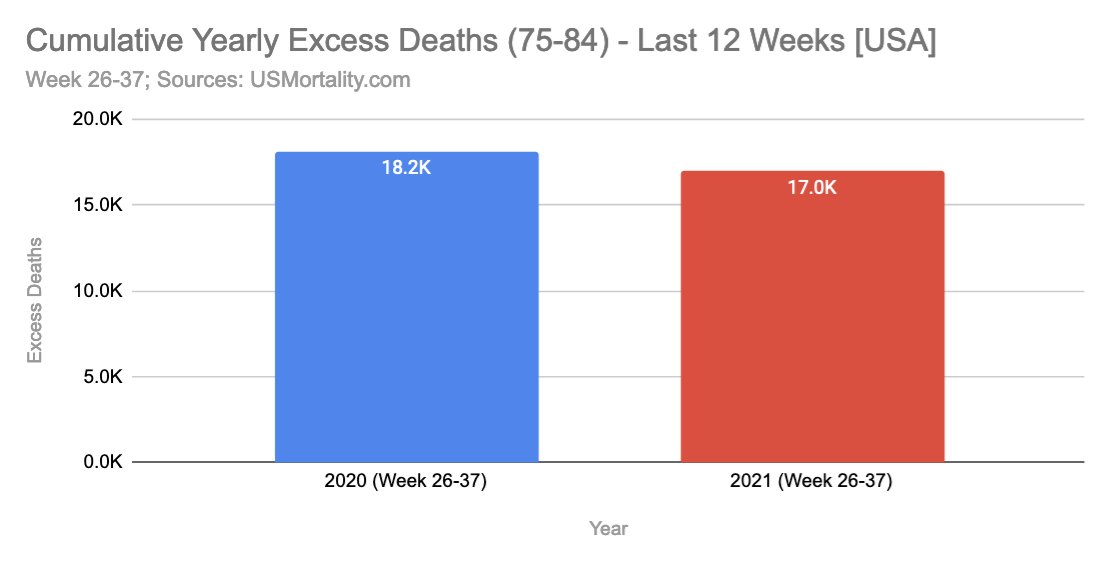
In the last 12 weeks, there have been about ~60k excess deaths in seniors, despite extremely high vaxx rates (95%+).
Here are the excess deaths for seniors. They are basically unchanged (-7.1%) in the same time frame '20 vs '21.
• • •
Missing some Tweet in this thread? You can try to
force a refresh
A list of statistical tricks, that can be used to calculate an illusion of vaccine efficacy with a placebo alone.
For this exercise, I have used a sine wave to simulate weekly deaths:
... and a logistic growth function to simulate placebo vaccination from 0 to 75% of the population.
By the green/red dots, we can see no difference/effect, as no statistical tricks are applied yet.
Trick 1: Unknown Vaccination Status --> Unvaccinated.
If 50% of Unknown vaccination status is treated as unvaccinated, almost 3x higher mortality rates appear for unvaccinated. This is entirely an illusion.
🔥 All-cause mortality by vaccination status from the Netherlands shows likely no vaccine efficacy, possible harm!
Deaths per 100k population by vaccination status shows an initial spike for the vaccinated during the vaccination rollout, and consistently higher mortality levels.
The initial peak may be related to confounding as more elderly/frail were prioritized, to reporting artifact (Fenton et al.), or vaccine harm.
Only focusing on the mid 2021 data, where the lines move in tandem, we still see a diverging of rates after the late 2021 winter peak.
Here adjusted for the levels during extremely low COVID-19 prevalence in Summer of 2021, we can possibly see, no efficacy and a drop for unvaccinated and slight increase for vaccinated, possibly even indicating negative efficacy?
💥💥💥 The latest official New Zealand FOIA data of All-Cause Mortality by COVID-19 vaccination status & age, shows that the vaccinated are the driver of all-cause excess mortality!
Clearly, unvaccinated deaths did not account for any major spikes in excess mortality!
I have analyzed the official NZ data which was published due to a FOIA, and initially analyzed by @sco0psmcgoo.
Here split by age group & vaccination status!
0-20 and 100+ may be incomplete, but those are also rather small numbers.
Plotted against the official total monthly all-cause deaths from , shows a very close match of this dataset. stats.govt.nz
They give it all away in the package insert. Flu vaccines are a scam. By definition, they cannot work!
Moreover, they did not even bother to test for potential of these vaccines to cause cancer or mutations.
Yet, they use the say 14 day trick to claim efficacy!
Ontop of the viral strains, which contain multiple chemicals and biological substances, such as cow blood, this flu vaccine also contains mercury (THIMEROSAL)!
💥 Age-Adjusted Excess Mortality now available for Germany 2023!
> Reversal to trend in 2023, to only +0.8% excess.
> Confirms high excess mortality during vaccination campaigns.
> Both 2020 and 2023 completely normal.
#Covid #Covid19 #mrna #Vaccine