Time for a quick PA $BTC scalping tutorial
Hopefully this can help you guys out a bit when trading #Bitcoin or any other alt like $ETH, $SOL, $ADA, $LUNA, $FTT etc
Let's start with a blank canvas.
Thanks @Delta_Exchange also for your ongoing support guys
Hopefully this can help you guys out a bit when trading #Bitcoin or any other alt like $ETH, $SOL, $ADA, $LUNA, $FTT etc
Let's start with a blank canvas.
Thanks @Delta_Exchange also for your ongoing support guys

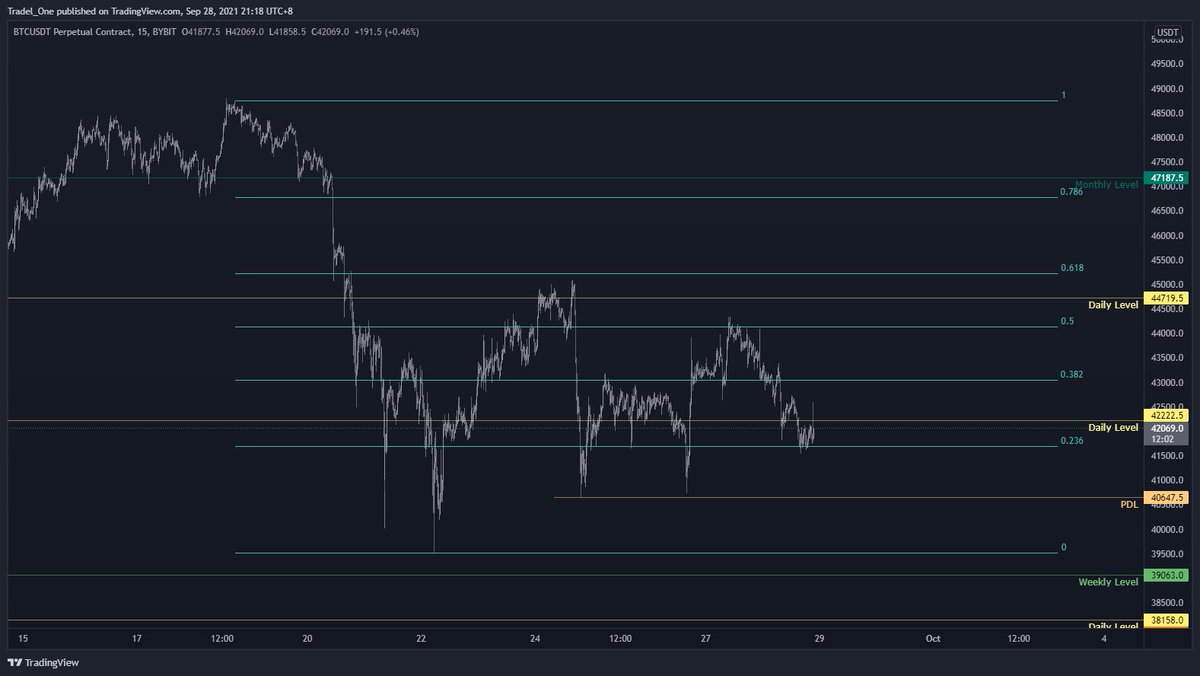
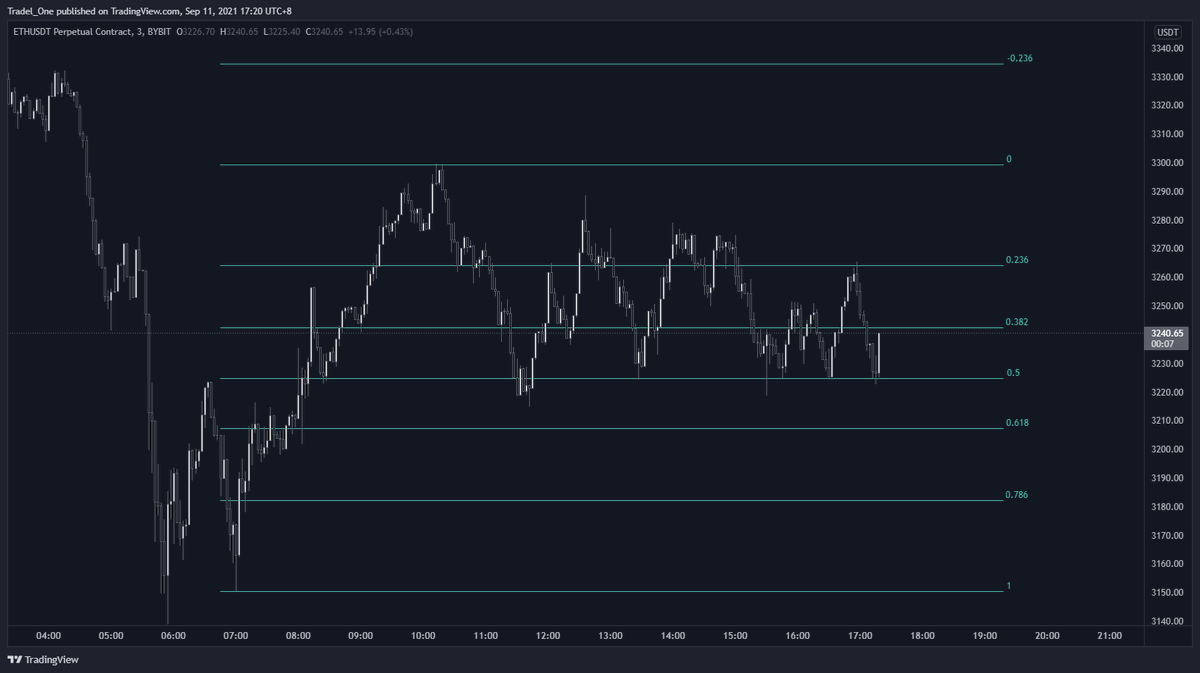
Setting up our range fibs, we can utilise some market structure that is now established

You can see that price is drawn to where the liquidity lies.
Here you can see that price consumes the sell side liquidity just below the range low, and then is drawn up to the buy side liquidity at the range high.
Here you can see that price consumes the sell side liquidity just below the range low, and then is drawn up to the buy side liquidity at the range high.

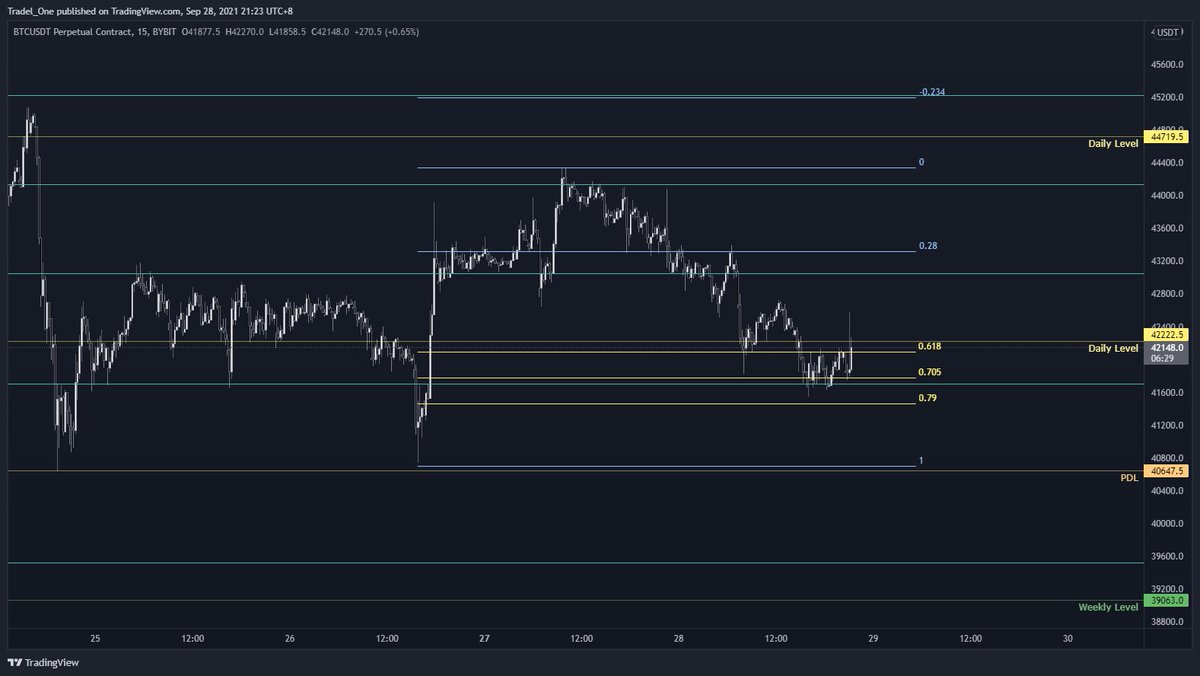
Price retests the order block above range high, this time meeting a relatively equal high of the previous tap, and then as @RektProof loves, a short set up is presented
Depends on your appetite, but aiming for mid range as a TP is always a good thing, with SL to BE in tight TF's
Depends on your appetite, but aiming for mid range as a TP is always a good thing, with SL to BE in tight TF's


Price then falls right into ICT's old OTE (Optimal Trade Entry) which is a bullish sign. If you're cautious, you could wait for a reclaim of the 0.5 mark before entry into OTE


Let's see what happens - do we hit the range high after and then tap that last lot of liquidity?
Or take a run back to range low, and then regroup from there.
Either way, we've got a bit of a plan right?
Thanks for reading guys
Say G'day to the oldies for me
🤝
Or take a run back to range low, and then regroup from there.
Either way, we've got a bit of a plan right?
Thanks for reading guys
Say G'day to the oldies for me
🤝


• • •
Missing some Tweet in this thread? You can try to
force a refresh