Following the government-mandated crackdown on the Chinese mining industry in June 2021, the US now emerges as the leading #Bitcoin mining centre with ± 35% of total hashrate as of August 2021.
Kazakhstan (18%) and the Russian Federation (11%) are following, thereby confirming the trajectory identified in our previous update showing that those three countries had already gained market share prior to the Chinese crackdown.
(We've added a new chart for absolute hashrate)
China's reported share of total hashrate is now, somewhat unsurprisingly, at 0%. While there are rumours of ongoing covert mining operations, any inferences on the basis of this data would amount to pure speculation.
As always, comments and feedback are welcome. Stay tuned for further updates!
Addendum:
China's recorded hashrate has effectively fallen to 0 despite (difficult-to-verify) reports of ongoing covert operations. This is due to natural trade-offs in our methodology which I explain below.
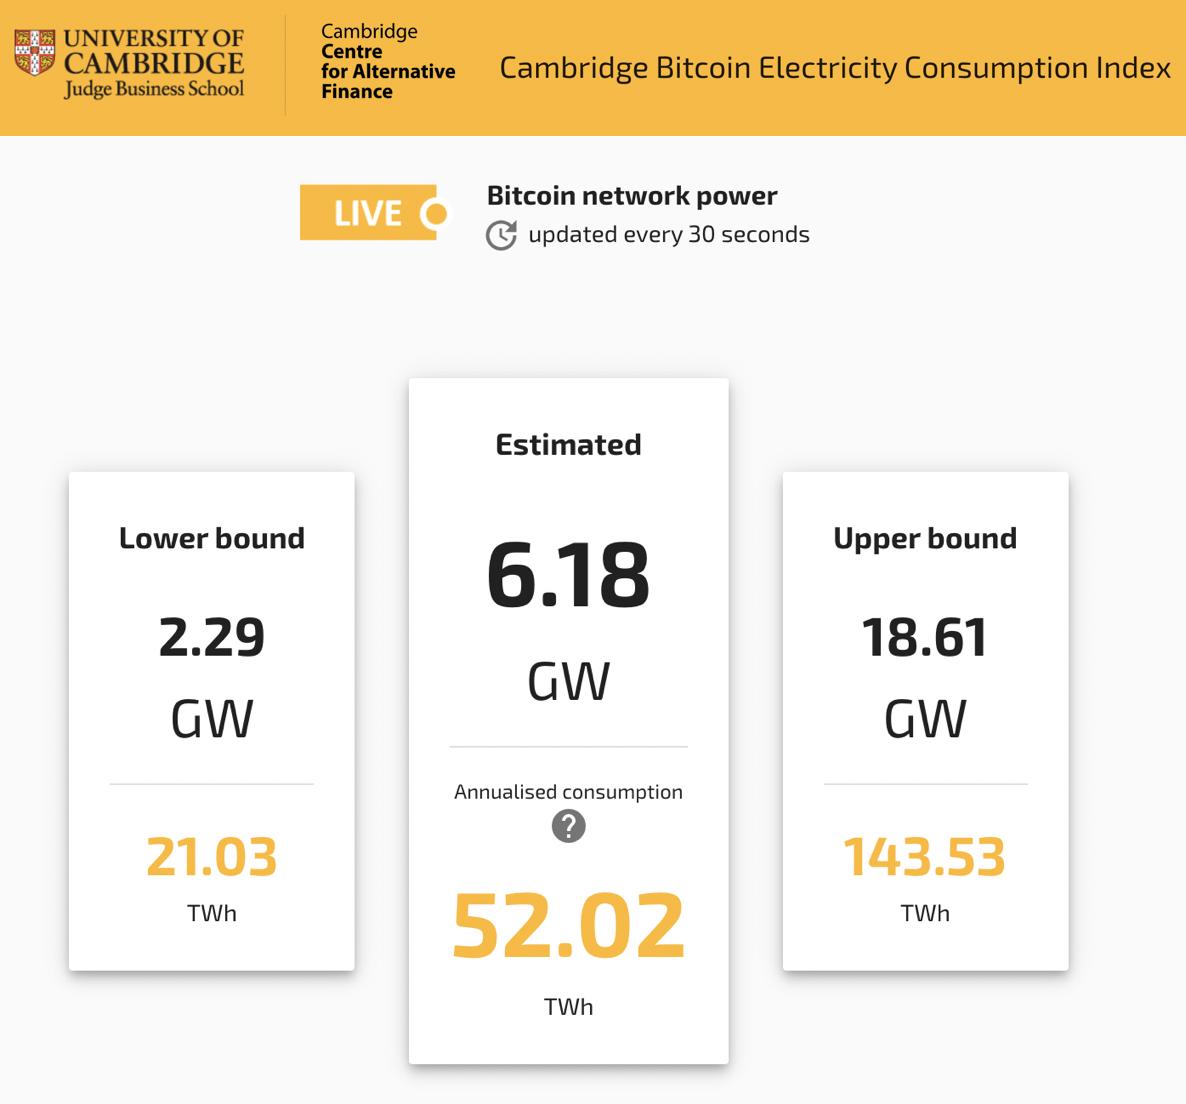
1) I'm delighted to announce the launch of the Cambridge Bitcoin Electricity Consumption Index (CBECI), a live model that tracks the estimated annual electricity usage of the Bitcoin network in real time.
2) The CBECI is a pilot project created and maintained by the @CambridgeAltFin in response to growing concerns over the sustainability and environmental impact of Bitcoin mining.
3) There are two diametrically-opposed sides in this debate:
a) "Bitcoin mining boils the oceans and directly contributes to climate change!"
b) "Bitcoin is the most efficient money ever devised and will drive the green revolution!"
This is the best analysis of Bitcoin's total electricity consumption that I've seen to date. As with any model, some assumptions are debatable, but overall this is some thorough work from Munich.
I should specify that this applies to the first part of the paper - estimating Bitcoin's total electricity consumption.
We @CambridgeAltFin are currently working on a real-time electricity consumption index based on a similar methodology that we'll launch in a few weeks.
However, I'm somewhat skeptical about the second part of the paper - i.e. estimating Bitcoin's environmental footprint.
While the chosen approach is interesting (see below), I can see a lot of issues.
1/ After some quiet and restful Christmas days (I hope everyone had a wonderful break 🎅🎄), here comes Part 2 of my mini series highlighting the key findings of @CambridgeAltFin's new cryptoasset report.
1/ Today, I'd like to have a look at Section 1 of @CambridgeAltFin's recently published 2nd Global Cryptoasset Benchmarking Study, which covers the cryptoasset industry structure.
2/ What do we mean by cryptoasset industry? While there are many additional service providers (e.g. data, ICOs, analytics/screening, etc.), we focus exclusively on four key industry segments in the context of this study:
- Mining
- Storage
- Exchange
- Payments
3/ The figure above shows that the exchange segment is the most popular among surveyed companies (72%), followed by storage (61%) and payments (49%).
1/ Let's get to the core of the report today; namely the conceptual framework that breaks down a #DLT system into distinct pieces in order to better understand the relationships between its elements.
2/ Speaking of elements: the framework consists of three types: layers, components, and processes.
Each layer is composed of a set of components, and each component comprises a set of processes.
In total, we identify 3 layers, 7 components, and 18 processes.
3/ Let's start with the base layer - the protocol layer.
The protocol layer is the foundation of the entire DLT system: it defines the set of formal rules that governs the system and codifies its architectural design.