1/3

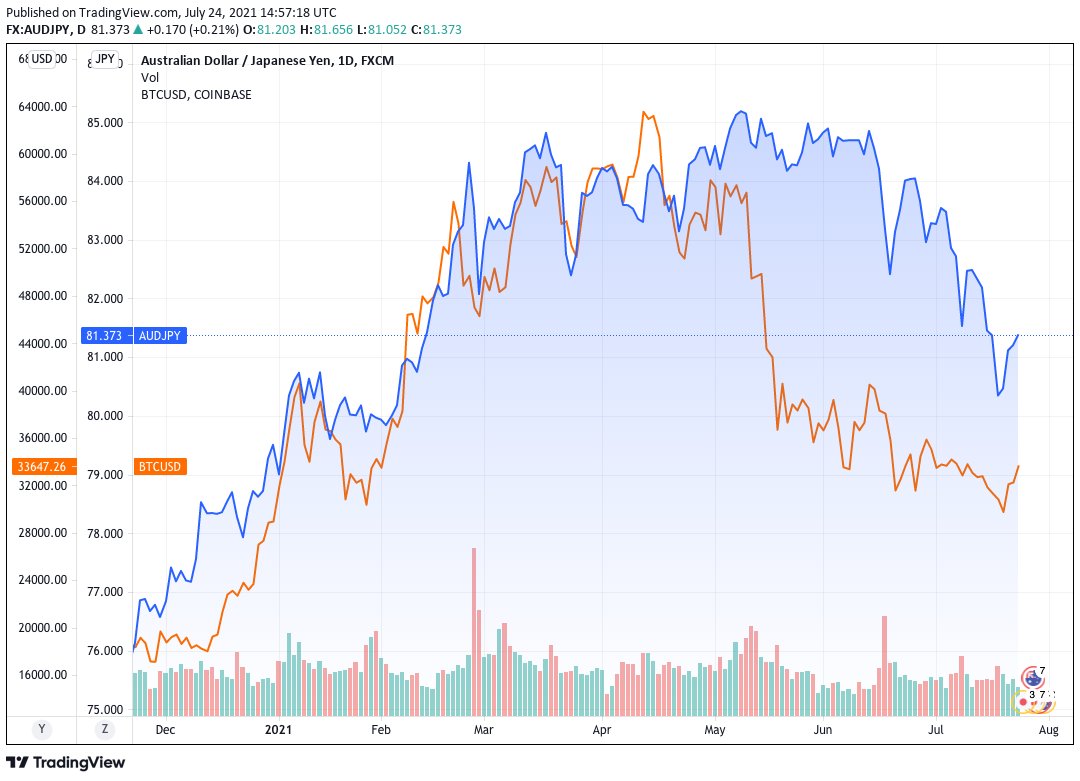
AUDJPY and BTC still both risky assets and somewhat joined at the hip with BTC leading more often and AUDJPY lagging.

Blue line is bitcoin, black is AUDJPY. Hourly since late August...
2/3

Hourly back to late 2020
Why? Both pairs are risky assets that loosely (but not perfectly) reflect the current level of money sloshing around in the system. When money gets sucked out, AUDJPY and BTC go down. When money comes back in, they go up. There are always leads and lags.

• • •

Missing some Tweet in this thread? You can try to force a refresh
 

Keep Current with ʎllǝuuop ʇuǝɹq

ʎllǝuuop ʇuǝɹq Profile picture

Stay in touch and get notified when new unrolls are available from this author!

Read all threads

This Thread may be Removed Anytime!

PDF

Twitter may remove this content at anytime! Save it as PDF for later use!

Try unrolling a thread yourself!

how to unroll video
  1. Follow @ThreadReaderApp to mention us!

  2. From a Twitter thread mention us with a keyword "unroll"
@threadreaderapp unroll

Practice here first or read more on our help page!

More from @donnelly_brent

22 Sep
1/4

Today's AM/FX non sequitur triggered some excitement and many smart people offered good explanations. Here is the best one:

Most of the U.S. airports (roughly 12,900 of the 13,513 that you mention) are class E or uncontrolled airspace airports usable by small craft ...
2/4

... (think Cessna 172). Of the ones usable by jet traffic, there are:

40 Class B airports (e.g. JFK, BOS, SFC)
116 Class C airports (Albany)
474 Class D airports (Westchester County)

My hunch (from having flown over various parts of the world piloting a large size PJ) ...
3/4

is that the likes of China and Russia have almost no uncontrolled airspace airports for reasons related the military deployment, history (very skinny pickings in private flight schools outside of major cities), weather, etc....
Read 4 tweets
24 Jul
1 of 4

Could be a good week for AUDJPY. Ozzie CPI odds favor a beat based on recent correlated data from TDMI + NZ + USA.

Another reason AU CPI could beat is the tendency for economists to anchor on prior (unrealistically low) data. Meanwhile, stonks and crypto show the way...
2/4

Note AUDJPY struggled after BTC peaked the night of
@elonmusk on SNL (see chart, BTC orange, AUDJPY blue) then dumped a few weeks after BTC dumped.

Now crypto looks bottomy. Commodities V-shaped and blowoff bottom in many altcoins. See chart of MATIC, for example.
3/4

Lockdown and Delta are obvious concerns (priced in?) but much as market was long AUD at .77 on the global reflation story, it feels like the market now getting short AUD on a 73 handle (+ the market is mostly out of large CAD longs, which helps .. see pic of CFTC CAD longs)
Read 5 tweets
19 Jul
New, interesting and relevant: Fed / Yale paper on stablecoins and wildcat banking.

"Taming wildcat stablecoins"

papers.ssrn.com/sol3/papers.cf…
Love this in the opening paragraph... Passive/aggressive choice of terminology... "The first category of cryptocurrencies includes those not backed by anything, like Bitcoin. We call these “fiat cryptocurrencies.” Their defining feature is that they have no intrinsic value."
"Finally, we note the urgency of this project. Some policymakers may view stablecoins as an up-and-coming financial innovation that does not currently pose any systemic risk and therefore believe that the best strategy is to wait to see how things play out....
Read 6 tweets
4 Jun
The demise of the dollar has been a popular media story throughout my entire life. Consume such stories with the understanding they have been around for 50 years. A few examples...
Same thing with US debt and deficits. Fear sells.
Read 4 tweets
3 Jun
Survey result 1. Economist estimates are much more clustered toward the mean than my survey respondents’ guesses because anonymous survey participants are not worried about looking stupid, unlike economists making public forecasts.

This is a known bias in economic forecasts.
Survey result 2. Question asked for your 80 percent confidence range for NFP this Friday.

Median range bottom 300
Median range top 900

A true surprise needs to be outside that range IMO
Survey result 3. #BTC
Read 5 tweets
3 Jun
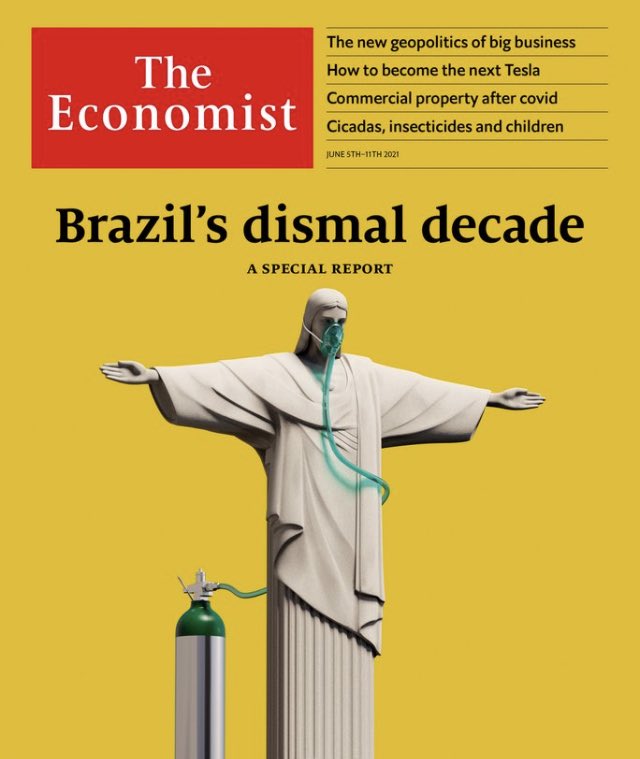
Reverse indicator, bullish Brazil over one year time horizon. Hit rate was 68 percent when we did the comprehensive lookback study in 2016.
Read 4 tweets

Did Thread Reader help you today?

Support us! We are indie developers!


This site is made by just two indie developers on a laptop doing marketing, support and development! Read more about the story.

Become a Premium Member ($3/month or $30/year) and get exclusive features!

Become Premium

Too expensive? Make a small donation by buying us coffee ($5) or help with server cost ($10)

Donate via Paypal Become our Patreon

Thank you for your support!

Follow Us on Twitter!

:(